April 26, 2022 Updated October 22, 2023

This is what is known as a reversal pattern

You can learn essential chart patterns that help you anticipate when a trend will reverse. One such pattern is the Double Top. This is one of the more reliable patterns that signal a coming downtrend in prices.
Once you learn to recognize this pattern, you can see the best point to get out of a position and take your profits. Read on to identify the pattern itself, as well as the best place to sell. 2. What is a double top pattern?
. It indicates that an uptrend may be ending and a downtrend beginning because buyers are getting tired. Sellers could take over, driving the price down. When there are more sellers than buyers, prices drop. The Double Top shows that buyers try twice to move prices higher and fail. Hence, “Double Top.”

Here is a real-world double top from the S&P 500 Index ETF that occurred from February to March of 2022.
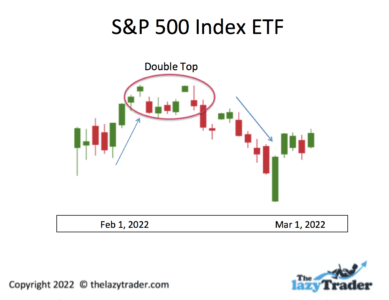
The Double Top pattern does work, though you should be aware that no pattern works all the time. That said, this is one of the more reliable patterns because it gives you two warnings. In fact, it is best to wait until the second warning to take action. This delay means you don’t have to make split-second decisions. Use this pattern to make a calm, purposeful trade.
You should be aware that the Double Top pattern is part of technical trading, as opposed to fundamental trading. Let’s look at some key differences.
In practice, traders may use both approaches, but they tend to lean more toward one of them.
Reading charts is what is called technical trading. You pay attention to what prices are doing and make decisions based on that. On the other hand, fundamental trading involves examining how the company is doing in terms of sales, profits, debt, and growth.
The pattern makes trading more objective – When prices are making big up-and-down moves, it is easy to get emotional and make bad decisions. The Double Top pattern makes it clear what prices are doing objectively and organizes your understanding into distinct stages.
It is a proven technique – Double Tops have proven themselves time and again. It is not a guarantee of a reversal, but it strongly suggests one. The Double Top has been used for a long time. It dates to the 18th century. Munehisa Homma, a rice trader in Japan, noticed patterns and developed a method to track them.
Accessible and easy to understand – You can access charts on many platforms and readily see Double Tops. They are simple to read and easy to interpret.
It helps to provide clarity –Visualizing price action near the top of a trend helps you understand a pattern. Simply checking prices each day won’t give you a sense of what is happening.
It reflects the psychology of the market – Price action tells you what people think an asset is worth. When a price shoots up or falls, you know they are gaining or losing enthusiasm.
It lags as an indicator – A Double Top forms as you watch, but you can’t be sure it is one until the pattern is complete. You may want to make a decision before then.
It can be ambiguous when viewed on multiple timeframes – The longer a Double Top takes to form, the more other patterns may interrupt it or make it hard to read. A long Double Top seldom makes a nice, neat “M” shape.
Viable trade setups can be invalidated by unpredictable news or data releases – Sudden news can disrupt a pattern. If traders get emotional in response to an event, they may start panic selling or begin buying based on a rumor. You can overlook important news about a company because you are convinced about what a price pattern seems to be telling you. If you dedicate yourself entirely to a technical approach, you could miss major company announcements that can affect the price.
You might also overlook economic reports – For example, if the economy is headed into a recession, many patterns will fail. You can be caught “off guard” by focusing on price action for an asset and ignoring the economic environment.
The difference in Double Top patterns depends on how long they take to form.
Very quick ones may take a few days to form. These are the least reliable because they may not shake out all the buyers. This short pattern is for day traders who want to get in and out fast.
Medium ones can take two to three weeks to form. You can see the pattern developing slowly and start planning to sell your position.
Double Tops that take a couple of months tend to be more reliable
It’s easy to see a Double Top long after it has formed. Let’s look at how to recognize one while it is developing.
If prices have been going up for a long time–as in weeks–you might see some hesitation or a slight drop. This does not mean by itself that a Double Top is forming. It means you should start paying attention.
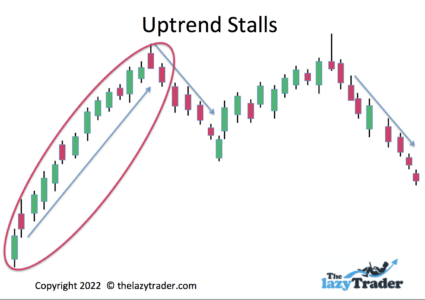
This could be a slight pullback. If you want to stay in and see if prices go higher, hold on for now. However, if you have good profits already, you can take them here. Long-term traders tend to wait and see at this point.
After a drop, you see prices turn and head higher. You now have a decision to make. If prices reach the level of the previous high, will you sell and take your profits?
Reaching the high again does not by itself mean you have a Double Top. It could go higher. It might be best to see if prices will drop from that level before making your decision.
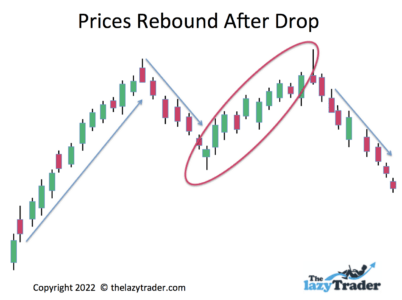
The rise back up can be setup for you to get ready to sell.
The Double Top has formed.
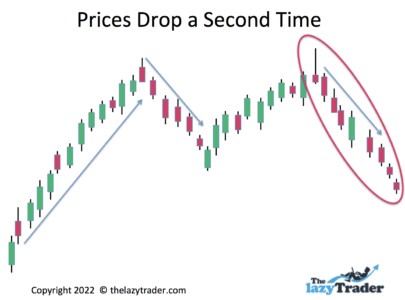
The fall from the second high indicates prices will drop much further. Buyers have been “shaken out.”
In addition to the Double Top, you will hear about the Double Bottom.
Here’s the difference:
A Double Top occurs at the end of an uptrend and indicates prices could go down. A Double Bottom occurs at the end of a downtrend and indicates prices could go up. Compare them in the chart below.
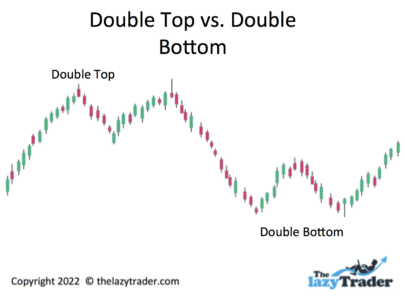
The two patterns do not necessarily follow each other. They are shown together here so you can compare them.
Do not plunge into technical trading without knowing the ins and outs. A Double Bottom Pattern is part of a bit set of patterns that traders use. Once you learn how patterns work, you get a “knack” for reading them.
In particular, you need to understand candlesticks. These are graphic representations of the price action. They require much study to use them well. See a complete guide to candlestick trading for details on getting started.
Here are some other learning resources for you:
Trade What You See How to Profit from Pattern Recognition by Larry Pesavento
This is a book to help you recognize patterns in charts. It is especially useful for learning to find patterns while they are developing instead of merely identifying them after they have developed.
Trading In The Zone by Mark Douglas)
This book on general trading principles covers things like eliminating bad habits and remaining consistent in your strategy. It shows how to trade probabilities and ignore anomalies.
Udemy Technical Trading
Udemy offers a comprehensive guide to all aspects of technical trading and is a reliable source for valid information. Though they promote their own courses as part of this course, you won’t get come-ons to draw you into long-term commitments.
Travis Rose
This is a good place for beginners to start. Rose covers all the basics and leads you through the analysis of technical patterns.
Bullish Bears
A learn-as-you-go approach works well at Bullish Bears. You build your skills systematically while actually trading. You can elect to make practice trades with no actual money invested.
Blogs can be good if they are offered by a pro with a track record. Look for blogs that walk you through various technical trade setups in the actual market. Keep score and see how often the blogger is right.
Here are some to look at:
Adam H. Grimes
Grimes has more than 20 years of experience and covers all types of trades, from breakouts to reversals of trends. His posts walk you through trades and keep you abreast of trends in the current marketplace.
Top-Down Charts
The emphasis here is on the macro trends. Great for learning how large trends affect individual charts. While you do want nuts-and-bolts training on how to trade, this focus on trends and the economy is essential to giving context to your trading strategies.
Marc to Market
This daily blog focuses on Forex. Note that many of the technical trading principles of Forex apply to trading stocks as well.
Be aware that forums allow anyone to express an opinion. Take all advice in stride, as you do not always know the credentials of the poster.
Some popular ones:
Elite Trader
Elite Trader offers forums on every type of trading style and approach. It is a good idea to join discussions that may be outside of your current interests so you can learn about various methods. Look at the general technical forums first, and then launch into technical forums on stocks, forex, commodities, etc.
Morningstar
Morningstar forums have some quality input from experienced technical traders. You won’t find any wild observations or insights here, but keep in mind that not everything in a forum is reliable.
Look for newsletters from seasoned pros. A good newsletter will give you tips and specific recommendations.
Here you will find in-depth chart analysis. This is the most helpful way to learn because each newsletter uses current technical setups. You can see actual patterns developing in the marketplace.
The focus is on the Relative Strength Index. This index alone can show you reversal points and entry points. The strength alerts in this newsletter are invaluable for anyone wanting to use technical analysis.
There are a variety of newsletters here to choose from. Select those areas of technical analysis you want to learn, and follow them regularly to get a knack for spotting trends and trading patterns.
Podcasts are like newsletters but choose an expert, not just someone selling something.
Allstarcharts Podcast on Technical Analysis Radio
This podcast offers timely insights into technical setups, trends, and reversals happening in the current marketplace.
Investing with IBD
Investor’s Business Daily has a particular focus on the “cup with handle” pattern. This is a fairly reliable pattern. Each podcast helps you recognize this pattern developing and may give you entry points for your trades.
YouTube is the home for many a fake guru, so beware.
Examine:
The Only Technical Analysis Video You Will Ever Need
While the claim made in the title is a bit over-the-top, this 45-minute video does take you through many technical analysis examples in detail.
Webinars can be thinly disguised sales pitches. Make sure you learn nuts-and-bolts information.
Online Trading Academy
This gives a solid approach to technical trading, with examples.
Technical Analysis–Fidelity
Fidelity is a reliable name, and the variety of technical trading webinars here adds a comprehensive and trustworthy series that can help you profit.
You have to be comfortable with technical trading in general and the Doube Top in particular. Though some suggested sell points can be shown, patterns don’t always form nice neat shapes, and you will have to do some interpreting.
You must be prepared to watch price action daily so you can catch the pattern forming at the beginning.
Learn patience. Stick to your rules and use a slow, steady approach to creating wealth. This is investing, not gambling. The Double Bottom offers you time to make and execute a strategy, and once you have your plan, stick with it.
In addition to setting your automatic sell orders, you can limit your risk by placing 1-2% of your account value into any trade. Never put more than that into any single asset purchase.
The critical word to remember is “proven.” Simply making rules up is not a proven strategy. You have the benefit of decades of successful investing by others. Do some research.
Track your trades and determine how many were successful. Then look at the successful trades and learn why they worked, what signals you interpreted, and whether you chose a good entry point.
Also, look at the losers to see if there is something you should have noticed. Keep in mind, however, that there will always be a percentage of losing trades. Some investments don’t go in the direction the pattern would suggest.
This platform works well for technical traders. You can see a variety of charts to identify patterns, and this includes, of course, the Double Bottom pattern. You can go straight from the chart to placing a trade order.
There is no cost for online trades, and you can trade from your phone if you prefer. You can use the paperMoney account to practice trading without actually investing money.
This platform is also available in the USA. However, eToro USA LCC does not offer CFDs, only real Crypto assets available.
This site offers a wide variety of investment vehicles, from stocks to cryptocurrencies. The stock offerings are worldwide, making this a google place to invest internationally. The charts are easy to read, making it easy to spot Double Bottoms and other patterns.
The demo account works in real-time so you can watch patterns develop and track what your profits and losses would have been if you had invested money. Stock trades are free.
eToro is a multi-asset investment platform. The value of your investments may go up or down. Your capital is at risk.
This is a good place for beginners. You open a free account and get immediate access to the demo version. The site includes thousands of international stocks. When you decide to start investing, the minimum deposit is only $20. You will find good educational and research sources here.
You can trade stocks from 25 markets worldwide. Importantly, you can buy fractional shares. This is good for expensive stocks where one share can cost hundreds or even thousands of dollars. You can buy a fraction of a share for much less. The demo account, Active Trader Pro, allows you to place as many as 50 orders at once (no actual money is invested). You can use technical indicators and create your won charts.
You can access the free demo without even opening an account. Here you can “paper trade” thousands of stocks from the U.S., the U.K., and Europe. Even when you decide to open an account and invest real money, there is no charge for trades.

Trend – A Trend is a sustained price direction (either up or down). “Sustained” usually means weeks. For example, traders usually call a brief downtrend a “dip” or a “pullback.”
Pattern – Over time, the price action will form a “shape.” Traders have come to recognize that these shapes have occurred throughout trading history.
Reversal Pattern – A reversal is a change in price direction. There are reversal patterns when prices reach a top or a bottom. You should know both. If you sell as the result of a Double Top, prices may reverse and go back up at some point. Know your patterns.
Stop-Loss Order – You place a sell order that automatically triggers if prices drop to a specific point. You choose this based on your tolerance for losses.
Limit Order – This is a buy order that specifies the price at which you want the trade to execute. In other words, it is the most you are willing to pay. You can miss an opportunity if the price jumps up dramatically and is higher than the limit you set.
Getting Stopped Out – This happens when you set a stop-sell order too close to the current price. Normal fluctuations can cause the price to drop momentarily, triggering a sell when you don’t want one. Look at the price history and determine how much it fluctuates as a rule.
Target Price – Many analysts name a target price for an investment, meaning they think it will rise to that point. Don’t follow these blindly. Analysts can be wrong, and they never tell you what pullbacks and drops may occur on the way to the target price.
Trading the News – Sometimes the market responds to good or bad news. You may get the feeling you need to jump in or get out. The problem is that these are often overreactions. Trading the news is day-trading, not long-term investing. Pick your approach and stick with it.
The Double Top pattern can be your friend if you take it slow. If you already have profits in your position, then selling a bit too early does little damage. But if you are in for the long-term, such as five to ten years, you could bail out of a position that may have provided stellar profits down the road.
It is essential that you study, track your winners and losers, and learn, learn, learn. Never claim you are an expert; consider yourself a lifelong student of investing.
You should see two peaks with a downward move in between. It looks like the letter “M.” Note that the final leg of the “M” continues downward indefinitely.
The final leg of the “M” continues downward indefinitely until you see a reversal pattern that sends prices back up.
It is important that you see an uptrend before a Double Top pattern. The longer the uptrend, the better.
They are a strong indicator. What makes them strong is that the high price is tested twice. That said, they can fail, so watch closely when one forms.