March 15, 2022 Updated August 1, 2023

This guide helps you understand the importance of the Double Bottom pattern. Traders use this formation to identify when a stock, commodity, cryptocurrency, or other investment has gone as low in price as it is going to go. Once you understand how to recognize and trade a Double Bottom pattern, you may buy at the best price and thus create profits.

When a stock sells off, bounces back up, then sells off again to the recent low, traders call the pattern a Double Bottom. The idea is that sellers who didn’t get out at the previous low waited to sell when the price rose. That selling drives the price down to the low of the previous selloff.
Savvy traders wait for the second low to occur, then buy the stock when it bounces back up.

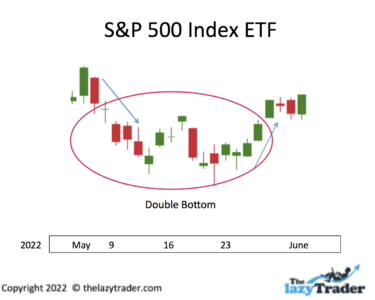
The price chart forms a “w” that appears at the end of a downtrend.
Here is a real-world example of a Double Bottom. This occurred between the 9-29th May 2022 in the S&P 500 index.
The Double Bottom pattern is part of the discipline of technical trading that began in the 18th century in Japan. Munehisa Homma, a rice trader, recognized patterns in price charts and realized those patterns revealed the psychology of buyers and sellers.
Then Confucian scholars in China published a manual on recognizing price patterns and market manipulation. In the 19th Century, Charles Dow developed the idea of average price movements to track trading chart patterns.
Followers of Dow’s work developed the idea of price averages to create what we recognize today as technical trading–making buy and sell decisions based on chart patterns rather than company fundamentals like profits, debt, and revenues.
The Double Bottom is a significant pattern in technical analysis that most technical traders use.
A Double Bottom signals the reversal of a downtrend. The longer the downtrend, the more likely a double bottom indicates that buyers are starting to dominate the price action. No pattern is a guarantee, but the Double Bottom pattern has a nearly 80% success rate, meaning if you trade based on it, you have an 80% chance prices will rise.
The secret to how the Double Bottom works is in the word “double.” The price must hit a low, rise from there, sink back to the low, and rise from the second low. Think of it as shaking all the sellers out. The ones who wish they had sold at the first bottom see an opportunity to get out when the price rises the first time. But more sellers means prices go down, and the chart “tests” the previous bottom price (approximately). Now buyers come in again and drive the price back up. Getting in at this point is a reasonably reliable strategy.
There are some “cons” to consider with the Double Bottom:
There are many “pros” to trading the Double Bottom.
There are basically two kinds of investors: those who predict and those who respond. If you have a high risk tolerance, you may try to get in early while the pattern is still forming. But those with lower risk tolerance wait until they see confirmation that the Double Bottom is over and a new direction has developed. How to tell the difference? Let’s look at some examples.
You must watch a Double Bottom through its phases to know when to get in.
Here we see that prices have taken a sustained tumble. The price may be near a low point. Investing at this point is known as “catching a falling knife.” You have no idea if the stock will stop falling; you just make a guess. This is the riskiest choice.
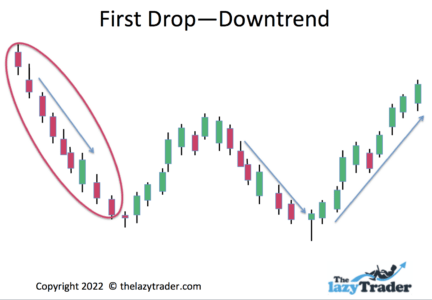
A long downtrend can be a setup for a Double Bottom
Anyone who tells you to “always” do this or that is pretending to have a crystal ball. Let’s just say that a sudden bounceback of a stock is not as reliable as waiting to see how it performs after the bounce.
In fact, there is a term called a “dead-cat bounce.” The idea is that even a dead cat will bounce if you drop it from high enough. But that bounce doesn’t mean it has come back to life. Similarly, a price bounce may be temporary.
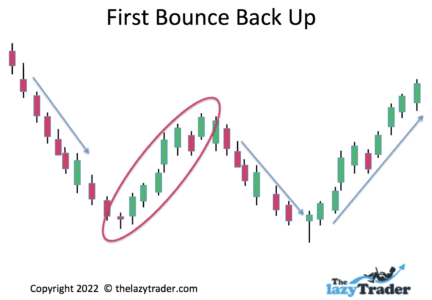
If a significant bounce occurs, a Double Bottom may be forming.
If the price drops again, wait for it to reach approximately the same low as before.
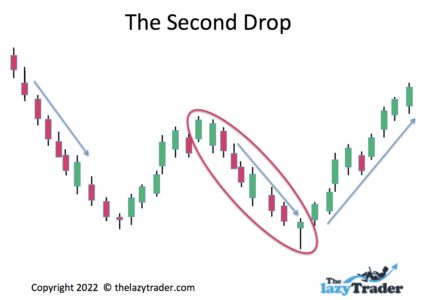
“Retesting” the low is common. You still don’t know if it is going to bounce again.
If the price rises after the second drop, the odds of having a Double Bottom increase. Cautious investors will wait until the price rises above the recent high.
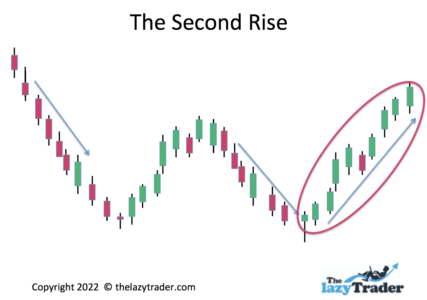
Buying after beating the latest high increases your chances of success.
There are five ways to exit a trade after buying into a Double Bottom Pattern.
An effective exit strategy requires discipline–once you make a rule for yourself, stick to it. If you feel you might get emotional and break your exit rule, use one of the automatic sell options. Risk management is your first duty to yourself. Preserving your investment funds is much easier than replacing them.
In addition to the Double Bottom, you will hear about Double Tops. Here’s the difference. A Double Bottom occurs at the end of a downtrend and indicates prices could go up. A Double Top occurs at the end of an uptrend and indicates prices could go down. It’s easier to understand if you compare charts of each one.
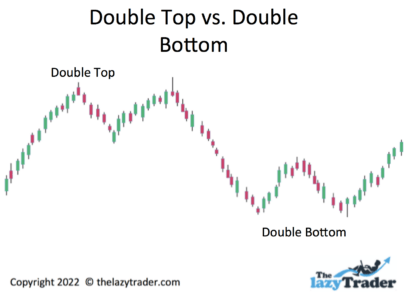
In practice, a Double Bottom wouldn’t occur so soon after a Double Top. They are shown together here so you can understand the relationship.
Do not plunge into technical trading without knowing the ins and outs. A Double Bottom Pattern is part of a bit set of patterns that traders use. Once you learn how patterns work, you get a “knack” for reading them.
Here are some resources for you:
Trade What You See How to Profit from Pattern Recognition by Larry Pesavento
This is a book to help you recognize patterns in charts. It is especially useful for learning to find patterns while they are developing instead of merely identifying them after they have developed.
Trading In The Zone by Mark Douglas)
This book on general trading principles covers things like eliminating bad habits and remaining consistent in your strategy. It shows how to trade probabilities and ignore anomalies.
Udemy Technical Trading
Udemy offers a comprehensive guide to all aspects of technical trading and is a reliable source for valid information. Though they promote their own courses as part of this course, you won’t get come-ons to draw you into long-term commitments.
Travis Rose
This is a good place for beginners to start. Rose covers all the basics and leads you through the analysis of technical patterns.
Bullish Bears
A learn-as-you-go approach works well at Bullish Bears. You build your skills systematically while actually trading. You can elect to make practice trades with no actual money invested.
Blogs can be good if they are offered by a pro with a track record. Look for blogs that walk you through various technical setups in the actual market. Keep score and see how often the blogger is right.
Adam H. Grimes
Grimes has more than 20 years of experience and covers all types of trades, from breakouts to reversals of trends. His posts walk you through trades and keep you abreast of trends in the current marketplace.
Top-Down Charts
The emphasis here is on the macro trends. Great for learning how large trends affect individual charts. While you do want nuts-and-bolts training on how to trade, this focus on trends and the economy is essential to giving context to your trading strategies.
Marc to Market
This daily blog focuses on Forex. Note that many of the technical trading principles of Forex apply to trading stocks as well.
Be aware that forums allow anyone to express an opinion. Take all advice in stride, as you don’t always know the credentials of the poster.
Some popular ones:
Elite Trader
Elite Trader offers forums on every type of trading style and approach. It is a good idea to join forums that may be outside of your current interests so you can learn about various methods. Look at the general technical forums first, and then launch into technical forums on stocks, Forex, commodities, and so forth.
Morningstar
Morningstar forums have some quality input from experienced technical traders. You won’t find any wild observations or insights here, but keep in mind that not everything in a forum is reliable.
Look for newsletters from seasoned pros. A good newsletter will give you tips and specific recommendations.
Here you will find in-depth chart analysis. This is the most helpful way to learn because each newsletter uses current technical setups. You can see actual patterns developing in the marketplace.
The focus is on the Relative Strength Index. This index alone can show you reversal points and entry points. The strength alerts in this newsletter are invaluable for anyone wanting to use technical analysis.
There are a variety of newsletters here to choose from. Select those areas of technical analysis you want to learn, and follow them regularly to get a knack for spotting trends and trading patterns.
Podcasts are like newsletters but choose an expert, not just someone selling something.
Allstarcharts Podcast on Technical Analysis Radio
This podcast offers timely insights into technical setups, trends, and reversals happening in the current marketplace.
The Weekly Trend
This podcast provided technical analysis for all markets that are traded publicly.
YouTube is the home for many a fake guru, so beware.
Examine:
The Only Technical Analysis Video You Will Ever Need
While the claim made in the title is a bit over-the-top, this 45-minute video does take you through many technical analysis examples in detail.
Rayer Teo
Here you will find some good ways to interpret charts.
Webinars can be thinly disguised sales pitches. Make sure you learn nuts-and-bolts information.
Online Trading Academy
This gives a solid approach to technical trading, with examples.
Technical Analysis–Fidelity
Fidelity is a reliable name, and the variety of technical trading webinars here add up to a comprehensive and trustworthy series that can help you profit and
Just because a pattern is popular does not mean you should use it. If you are not the patient type, you may jump in early to what looks like a Double Bottom forming, only to find it fails. This pattern can take many days or weeks to form.
You must be prepared to watch price action daily so you can catch the pattern forming at the beginning. Make your predictions and see if they pan out. If you are satisfied you have a Double Bottom, at some point, you are going to have to pull the trigger. Buy it, but do not trust it. Set your sell rules and stick to them.
The other thing you must be ready to do is to let it run if it is rising. Do not let your daily watching trick you into getting nervous and selling to lock in your profit. There will be down days. As long as they do not drop to the sell level you have designated, hang in there.
You must also learn about reversal patterns so you will know when the price has peaked.
There is a story of a man who planted a seed in his garden, and every day he dug it up to see if it had sprouted. Of course, it never did because he kept disturbing it.
Investing is like that. Learn patience and do not sell every time there is a hiccup. Stick to your rules and plan for a slow, steady approach to creating wealth. Get-rich-quick schemes are for those who do not commit to learning how to invest properly. The markets have been around a long time, and every approach has been tried.
Think of it this way: NO “trick” has ever dominated the market and become a standard investment method. All gimmicks have given out, and investors returned to the tried-and-true methods. Go slow, stay rational, and think long term.
In addition to setting your automatic sell orders, you can limit your risk by placing 1-2% of your account value into any trade. Never put more than that into any single asset purchase.
The critical word to remember is “proven.” Simply making rules up is not a proven strategy. You have the benefit of decades of successful investing by others. Do some research. For example, look up what is a reasonable level for setting automatic sell orders. If you set them too close, you will get “stopped out” of many of your investments. Prices typically fluctuate and your sell order must allow for temporary drops in price.
That is just an example. Learn what successful traders have done in the past and are doing now. If you jump in without knowing any standards, you are gambling, not investing.
Track your trades and determine how many were successful. Then look at the successful trades and learn why they worked, what signals you interpreted, and whether you chose a good entry point.
Also, look at the losers to see if there is something you should have noticed. Keep in mind, however, that there will always be a percentage of losing trades. Some investments do not go in the direction the pattern would suggest.
This platform works well for technical traders. You can see a variety of charts to identify patterns, and this includes, of course, the Double Bottom pattern. You can go straight from the chart to placing a trade order. There is no cost for online trades, and you can trade from your phone if you prefer. You can use the paperMoney account to practice trading without actually investing money.
This platform is also available in the USA. However, eToro USA LCC does not offer CFDs, only real Crypto assets available. This site offers a wide variety of investment vehicles, from stocks to cryptocurrencies. The stock offerings are worldwide, making this a google place to invest internationally. The charts are easy to read, making it easy to spot Double Bottoms and other patterns. The demo account works in real time so you can watch patterns develop and track what your profits and losses would have been if you had invested money. Stock trades are free. eToro is a multi-asset investment platform. The value of your investments may go up or down. Your capital is at risk.
This is a good place for beginners. You open a free account and get immediate access to the demo version. The site includes thousands of international stocks. When you decide to start investing, the minimum deposit is only $20. You will find good educational and research sources here.
You can trade stocks from 25 markets worldwide. Importantly, you can buy fractional shares. This is good for expensive stocks where one share can cost hundreds or even thousands of dollars. You can buy a fraction of a share for much less. The demo account, Active Trader Pro, allows you to place as many as 50 orders at once (no actual money is invested). You can use technical indicators and create your won charts.
You can access the free demo without even opening an account. Here you can “paper trade” thousands of stocks from the U.S., the U.K., and Europe. Even when you decide to open an account and invest real money, there is no charge for trades.
There is no such thing as a risk-free investment. Though a Double Bottom is fairly reliable, you have to watch for pitfalls. Here are some to watch out for:
This means your order may not be executed within the restrictions you set. For example, if you place a “limit order,” you are indicating that you will pay no more than a specific price. If the order executes above that (rare), you should contact the broker to have the situation rectified.
Most execution difficulties arise from a “market order.” This means you will pay any price available. If the price spikes up temporarily, you may pay much more than you intended.
When an investment does not match your tolerance for risk, it is a mismatch for you. This commonly occurs when a long-term investor takes a gamble on a “hot” stock based on tips from a guru or friends. Mixing your stock portfolio with impulsive, high-risk trades destroys your focus and ability to reach your goals.
This is rare in stock trading. Counterparty risk is when one person in a transaction fails to deliver what was promised. For example, a seller would fail to deliver the shares you have bought. Since each person’s account has cash in it, the seller can’t withhold the money because the transaction is automatic. This risk occurs somewhat in commodities trading, where a seller promises to deliver a commodity for a set price. Still, it is quite rare.
You should watch out for this one. It occurs when you want to sell an investment, but there are few buyers, perhaps no buyers. This happens with “thinly traded” assets that have only a few people interested in buying. Look at the average daily volume for any investment vehicle. If there are only a few hundred trades per day, watch out. If the price starts to drop and you want out, you could get stuck with it.
Reversal patterns are riskier than buying into an existing trend. You are counting on a reversal of a trend. Trends continue until there is a disruption and you are hoping that a Double Bottom reversal will be a successful disruption of the trend.
A continuing trend can be safer to invest in than a reversal. However, they do not have as much potential for profit. A reversal runs a higher risk but offers more potential profit.
You must be aware of your risk tolerance. Do you want to go slow and steady by buying into a trend or do you want to take more risk with a reversal pattern?
Double Bottom patterns do fail. Don’t play the percentages when you hear that they are reliable up to 80% of the time. That may not apply to your particular trade.
Double Bottom patterns tend to be more reliable than one-day reversals. Because a Double BOttom takes days to weeks to shake out sellers, they are more likely to be gone after the second bottom, allowing buyers to take over.
Many novice investors give up too early and don’t allow time for prices to rise into the profit range. This comes from a lack of discipline. Don’t make emotional decisions based on worry and fear. Set a stop-loss order at a level of loss your can tolerate and don’t sell before then,. Discipline is your friend.
Save yourself some heartaches and losses by gleaning a few lessons from others’ experiences.
A “bottom” in a chart is a place where prices turn around and go back up. A Double Bottom is where the first turnaround fails and goes back down, then rises a second time. A good trader waits for the second rise to go higher than the first rise.
Watch for volatility. If there are huge swings up and down, stay out of the choppy waters and live to fight another day. Price directions are unpredictable period. This occurs when things like war, inflation, and business failures “spook” the market. You have a right to be confused, so avoid trading until you are not.
Look for long downward trends, covering weeks or months. These are the most likely to turn around. A Double Bottom that forms at the end of a long downward trend is a strong signal.
This pattern does not occur as often as other patterns because it requires a long, sustained downtrend to precede it. Remember that a downtrend can simply indicate the investment is losing money and will continue to lose money. Buyers have to come back in for a Double Bottom to occur.
Look for the shape of a capital “w” in the pattern. Just because a Double Bottom seems to occur doesn’t guarantee it will succeed.
No. You are dealing with psychology here, not precise math. If the second drop is near the previous one, that’s close enough–but wait for prices to rise from there.
Put away your crystal ball and stay out of the fortune-telling business. Guesses about the future can always be wrong. Trade based on what has happened instead of what you think is going to happen.
No. There are many reversal trading patterns.
Trend – A Trend is a sustained price direction (either up or down). “Sustained” usually means weeks.
Pattern – Over time, the price action will form a “shape.”
Reversal Pattern – A reversal is a change in price direction. There are reversal patterns when prices reach a top or a bottom.
Buy Point – This is the spot where you judge that the price direction will continue.
Exit or Sell Point – You can decide in advance of a purchase when you will get out. This can be a specific price or a percentage gain.
Stop-Loss Order – You place a sell order that automatically triggers if prices drop to a specific point.
Trailing Stop Order – A trailing stop order is like a stop-loss order in that it is an automatic sell point.
Limit Order – This is a buy order that specifies the price at which you want the trade to execute.
Getting Stopped Out – This happens when you set a stop-sell order too close to the current price. Normal fluctuations can cause the price to drop momentarily, triggering a sell when you do not want one.
Target Price – Many analysts name a target price for an investment, meaning they think it will rise to that point. Do not follow these blindly.
Trading the News – Sometimes the market responds to good or bad news. You may get the feeling you need to jump in or get out.
The Double Bottom pattern is one of the easiest to recognize. You would do well to learn it and watch for it in the marketplace. This can serve as a doorway to studying other patterns. You will hear names for many patterns, and you may get in the habit of considering them reliable. However, patterns are not guarantees, and in the final analysis, you need to develop good judgment, not just the ability to spot patterns.
Look for Double Bottoms in the past by studying charts that go back many years. You will get the knack for understanding when they have occurred.
The correct way to answer this is to say they have worked in the past. It is reasonable to expect that they will work–sometimes–in the future. Remember that even professional traders misjudge Double Bottoms. Watch this pattern daily.
You not only can teach yourself; you must. As you saw earlier in this guide, most instructions deal with the Double Bottom after it has formed. But you need to be able to identify one while it is forming.
Double Bottoms are a “turnaround” indicator. That is, they suggest prices are going to go in the opposite direction of what they have been. They occur at the bottom of downtrends. Your best bet is to look for a long downtrend–such as weeks or months. These are most likely to move all sellers out of the investment, clearing the way for buyers to take over.
A Double Bottom is reliable 79% of the time. But think about this: a Double Bottom that fails is 100% unreliable. Every trade has risks, even the “sure thing.” How reliable is using a double bottom?
It is relatively reliable. Some place the chances of making money off a Double Bottom around 80% But if you buy one of the 20% that fail, your odds of losing money are 100%–unless you place automatic sell orders to protect you from losses.