
December 25, 2021 Updated October 23, 2023
512
1 votes
Reading time: 1 minutes
Technical analysis is an approach to investing that involves reading and understanding charts. Over many years, technical traders have learned to identify price action patterns that suggest whether an asset may go up or down in value. Learn how to understand the indications a chart pattern may give you so that you can use technical trading techniques to improve your number of winning trades.
The firm's main research and development office is based in Tel Aviv Israel. It originally specialized in Forex and indices spreadbetting and CFDs but has recently expanded in stock trading also. At the time of writing, eToro has 2.2 out of 5 star on Trust pilot. The comments suggest that the platform offers some impressive features but withdrawing money can be difficult. Having said that, some of the negative reviews appear to be rants rather than constructive criticism. This can be examples of traders losing money through their own recklessness rather than eToro's fault. You should therefore take this reviews with a pinch of salt. OANDA is a global financial services company providing advanced currency solutions to both retail and corporate clients all over the world. In this article, we are going to review this broker’s trading options, tools, platforms, spreads, commissions, security measures, and educational resources to help traders make the right choice. AvaTrade offers a wide variety of trading solutions (spread trading, CFDs, and social trading), and peace of mind with its comprehensive regulation, covering the EU, Australia, Canada and South Africa. Clients can use a variety of platforms for discretionary and automated trading.![]() Best Award Winning Brokers
Best Award Winning Brokers Show Search Filters
76% of retail investor accounts lose money when trading CFDs with this provider.
76.6% of retail investor accounts lose money when trading CFDs with this provider. You should consider whether you understand how CFDs work and whether you can afford to take the high risk of losing
76% of retail investor accounts lose money when trading CFDs with this provider.
Technical analysis in stock trading is a methodology that predicts future price moves based on historical price data and volume data, as seen by market price patterns. It operates on the belief that all market information and future price changes are already reflected in the stock’s price. Thus, using historical price action, technical analysts and traders use various charts, patterns, and indicators to identify potential trading opportunities and predict whether the price is likely to rise (an uptrend) or fall (a downtrend).
In the 18th century, a samurai named Homma Munehisa traded rice. He developed candlestick trading, which is a form of technical trading. However, Charles dow, founder of Dow Jones in 1884, created the in-depth technical analysis that prevails today.
Technical analysis was once for a limited few who had access to advanced charts and trading technology. Real-time charts are available online, and any trader can execute trades through an online broker. This has increased the popularity of technical trading.
This type of trading can apply to various investment instruments, including stocks, Forex, and cryptocurrency trading.
Fundamental analysis focuses on how well a company is doing in terms of profits, sales, debt ratio, etc – i.e. the intrinsic value of the stock. The fundamental analyst buys an asset based on how the company is doing financially.
You can be a technical trader and still evaluate a company’s fundamentals. The two types of trading are not mutually exclusive. However, a technical trader is inclined to make buying and selling decisions based primarily on patterns, such as past price movements and price changes. Buying stock in a fundamentally sound company is usually timed by a technical trader to buy at the most advantageous point in the pattern.
Pure technical traders can and do ignore fundamentals altogether, choosing only to focus on market action.
You use technical analysis to identify trading signals which attempt to predict the price direction of an asset. By taking a position early in the development of a trend, you stand a chance of making profits.
A price trend tends to continue in the direction it is headed until something happens to reverse it. So if you buy into an upward trend, you have a reasonable expectation that it will continue until a reversal pattern develops. This makes technical trading reasonably reliable, though not guaranteed.
Technical traders use price charts, or candlestick charts, to analyze stock price movement and predict future price movements. You do not need to know all the advanced methods to get started. In fact, you need to make sure you understand basic technical trading techniques that will help you do a technical analysis of trading patterns.
Your first job as an investor is to preserve your capital. If you happen to get into a losing trade, it is vital to limit your losses so that you can forfeit the battle to win the war.
Here are two types of orders to use to prevent significant losses.
Stop-loss orders
As soon as you buy an asset, you place an order to sell it if the price reverses and drops. Choose a price at which you want to sell to prevent further losses. Allow for normal fluctuations in choosing your stop-loss price, but set an order that would be below what appears to be the usual amount of fluctuation.
Trailing stops
A trailing stop rises as the price rises. You place a trailing stop at, for example, five percent, and as the price rises, the stop price rises so that it is always five percent below the latest price. This not only protects against losses, but also allows you to take profits if the stop price has risen above your purchase price.
One of the most important things you need to know about an asset is the price trend. What general direction are financial markets headed? You should always buy in an uptrend. Yes, there are up and down fluctuations in a trend, but the overall direction is clear. Here are some ways to establish a trend.
Moving averages
A moving average is an indicator that shows the direction of prices over time. Traders generally use a short-term average and a long-term average. A healthy uptrend features a short-term average that is above the long-term average.
Enter a position when the short-term average crosses above the long-term average. 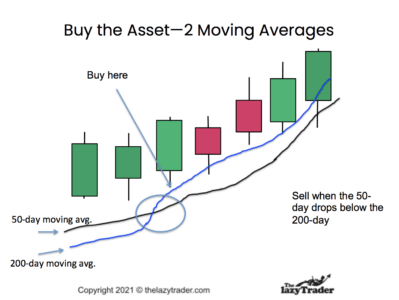
Exit a position when the short-term average crosses below the long-term average.
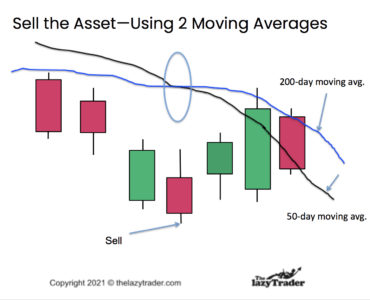
A moving average is a trailing indicator, meaning it shows what prices have been doing, not always what they will do. Place stop-loss orders when trading based on moving averages.
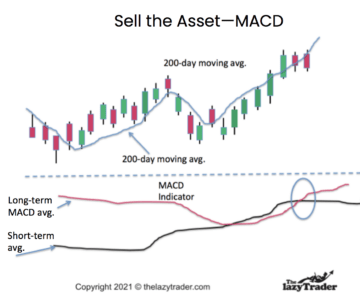
Moving Average Convergence Divergence (MACD)
This tool does the same work as described in the moving averages above. However, the time frame for the averages is set differently, so it moves faster and lets you see the crossover points more quickly.
You see divergences and convergences as they develop.
Enter a position when the short-term average crosses above the long-term average. 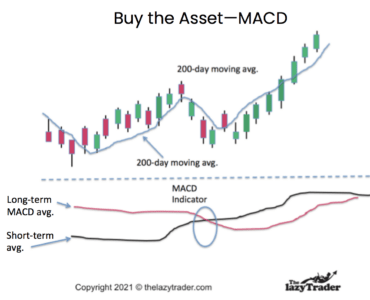
Exit a position when the short-term average crosses below the long-term average.
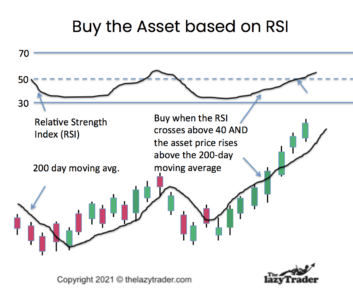
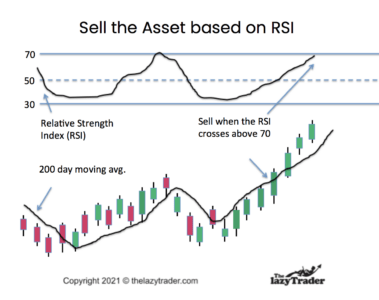
The relative strength index (RSI) shows when an asset is overbought or oversold. An RSI of 70 indicates an asset is overbought and is likely to drop in price, while an RSI of 30 is oversold.
The RSI is a leading indicator, meaning it can be used to predict price directions.
Enter a position when the RSI rises above 30.
Sell when the RSI hits 70.
Support levels and resistance levels are prices where the asset has performed in a certain way in the past. A stock whose price consistently rises after dropping to a certain level is showing support at that level. A stock that consistently falls after hitting a certain level is hitting resistance.
The more often an asset responds to support or resistance, the stronger that indicator is.
Enter a position when the asset price hits support. 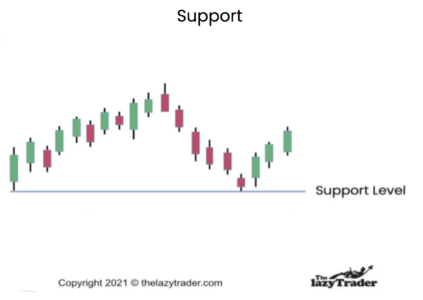
Exit a position when the price hits resistance–or wait to see if it breaks out above resistance.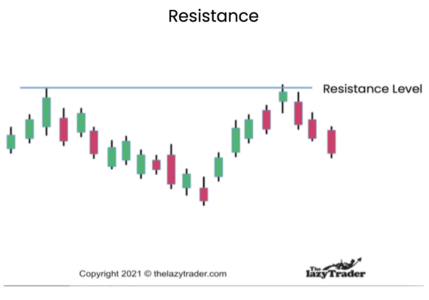
Breakouts occur when an asset rises above resistance. This can be the beginning of a new trend.
Breakouts need to occur on high volume. The volume indicator shows the change in the number of shares being traded.
Enter a position after a breakout on high volume.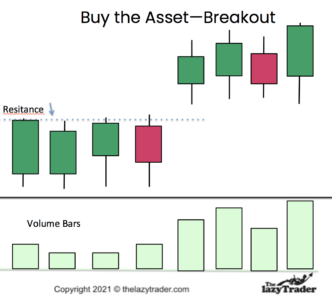
Exit a position if the breakout fails to follow through.
Cboe Volatility Index (Vix)
This is a measure of the overall volatility in the stock market. This means how extreme are the ups and downs in prices. An index reading between 12 and 35 is fairly tame, but higher than 35 means extreme fluctuations are possible such as a market correction.
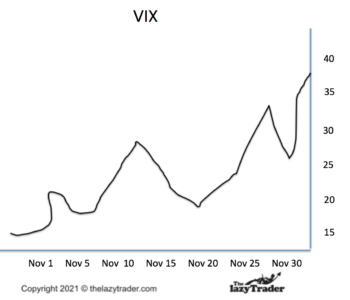
One way to use this indicator is to avoid trading during high VIX readings. These readings can mean you can lose money due to dramatic drops in prices. These drops can cause you to hit your stop-limit prices and automatically sell, only to see the price rise immediately. This is called getting “stopped out.”
Bollinger Bands
These bands measure overbought and oversold conditions for a single asset. When the price drops below the lower line of the band, the asset may be oversold and could bounce upward. Prices above the upper line indicate the asset is overbought and could drop soon. 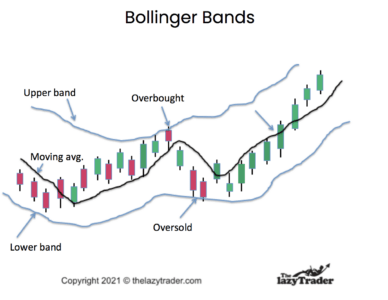
Bollinger bands should be used with other indicators to make sure you are reading the signals accurately.
Candlesticks
Candlesticks are a specialized type of technical trading. They require much study to use them well. See a complete guide to candlestick trading for details on getting started.
Trade What You See How to Profit from Pattern Recognition by Larry Pesavento
This is a book to help you recognize patterns in bar charts. It is especially useful for learning to find patterns while they are developing, instead of merely recognizing them after they have developed.
Trading In The Zone by Mark Douglas)
This book on general trading principles covers things like eliminating bad day trading habits and remaining consistent in your trading strategy. It shows how to trade probabilities and ignore anomalies. –
Udemy Technical Trading offer a comprehensive guide to all aspects of technical trading. It is a reliable source for valid information. Though they promote their own courses as part of this course, you will not get come-ons to draw you into long-term commitments.
Travis Rose is a good place for beginners to start. Rose covers all the basics and leads you through analysis of technical patterns.
Bullish Bears learn-as-you-go approach works well at Bullish Bears. You build your skills systematically while actually trading. You can elect to do practice trades, with no actual money invested.
Blogs can be good if they are offered by a pro with a track record. Look for blogs that walk you through various technical trade setups in the actual market. Keep score and see how often the blogger is right.
Adam H. Grimes has more than 20 years of experience and covers all types of trades, from breakouts to reversals of trends. His posts walk you through trades and keep you abreast of trends in the current marketplace.
Top-Down Charts, the emphasis here is on the macro trends, such as geopolitical risk. Great for learning how large trends affect individual charts. While you do want nuts-and-bolts training on how to trade, this focus on trends and the economy is essential to giving context to your trading strategies.
Marc to Market, This daily blog focuses on Forex trading. Note that many of the technical trading principles of Forex apply to trading stocks as well.
Be aware that forums allow anyone to express an opinion. Take all advice in stride, as you don’t always know the credentials of the poster. Some popular ones:
Elite Trader offers forums on every type of trading style and approach. It is a good idea to join forums that may be outside of your current interests so you can learn about various methods. Look at the general technical forums first, and then launch into technical forums on stocks, Forex, commodities, and so forth.
Morningstar forums have some quality input from experienced technical traders. You will not find any wild observations or insights here, but keep in mind that everything in a forum is not reliable.
Look for newsletters from seasoned pros. A good newsletter will give you trading tips and specific recommendations.
The Technical Indicator–Marketwatch, here you will find in-depth chart analysis. This is the most useful way to learn because each newsletter uses current technical setups. You can see real patterns developing in the marketplace.
Trade-Ideas Strength Alerts, the focus is on the Relative Strength Index. This index alone can show you reversal points and entry points. The strength alerts in this newsletter are invaluable for anyone wanting to use technical analysis.
Morningstar Investor Newsletters, there are a variety of newsletters here to choose from. Select those areas of technical analysis you want to learn, and follow them regularly to get a knack for spotting trends and trading patterns.
Podcasts are like newsletters but choose an expert, not just someone selling something.
Allstarcharts Podcast on Technical Analysis Radio. This podcast offers timely insights into technical setups, trends, and reversals going on in the current marketplace.
Investor’s Business Daily has a particular focus on the “cup with handle” pattern. This is a fairly reliable pattern. Each podcast helps you recognize this pattern developing and may give you entry points for your trades.
YouTube is the home for many a fake guru, so beware. Examine: The Only Technical Analysis Video You Will Ever Need. While the claim made in the title is a bit over-the-top, this 45-minute video does take you through many technical analysis examples in detail.
Webinars can be thinly disguised sales pitches. Make sure you learn nuts-and-bolts information.
Online Trading Academy, this gives a solid approach to technical trading, with examples.
Technical Analysis–Fidelity. Fidelity is a reliable name, and the variety of technical trading webinars here add up to a comprehensive and trustworthy series that can help you profit and avoid pitfalls.
Technical trading can feel like “flying blind” at first because you do not study the company for sales, revenues, and so forth. It is a good idea to start your technical trading with companies you know and trust. Choose stocks of companies that are doing well according to your understanding of the fundamentals.
Then you can focus on technical trading for that stock. This kind of transition from fundamentals to technicals can help you avoid choosing unsound companies just because you see a good technical indicator.
You must study, experiment on paper (no money actually invested), and learn from your mistakes. No indicator is 100% reliable. You have to get familiar with a few basic ones and practice, practice, practice.
Discovering technical trading is exciting. But while it may seem new to you, it has been around for centuries. You have not stumbled across a “get rich quick” scheme. It works pretty well, but you can also fail at it.
Technical trading requires a learning curve, and you will make trading mistakes. Keep your positions small when you start using actual money in your trades.
Even after you gain some experience, do not treat technical trading like gambling. Aim for slow and steady wealth-building based on your understanding of winning trades. In other words, do not rely on luck. Focus on when you are right and know why you were right.
Never put more than 1-2% of your money into any trade. You may want to start even smaller than that while you are experimenting and determining if technical trading is a good approach for you. Never ignore risk management when trading. It should be your primary focus, even before seeking profits.
Technical trending has been around for a long time. You do not have to choose strategies on your own.
Select an approach that has worked for others and stick with it long enough to see if you understand it and can make it work for you.
Most of all, establish rules for entry and exit on trades and stick to those rules.
Consider these platforms.
This platform allows traders to communicate like you do on Twitter and Facebook. You can share trading ideas and experiences with other traders. It is one of the leaders in social trading. One useful feature is the ability to examine stock portfolios managed by portfolio managers.
Ava offers platforms for multiple experience levels. You can automate your trades and follow expert traders to learn from their insights.
This platform is not available in the U.S. Naga allows you to copy the best traders on the platform. You can trade stocks, cryptocurrencies, and Forex across the world.
This Forex and CD broker makes it easy for traders to quickly start. You can trade Forex, stocks, commodities, metals, and cryptocurrencies.
FP uses the Autotrade tool. This allows traders to copy-trade, and it offers live statistics, along with risk-management systems. You can see the entire trading history of the most successful traders and mimic their methods.
The platform allows a low minimum deposit. Those trading for the first time can get started here. Free demo available. Trade forex, commodities, indices, stock, and cryptocurrencies.
Several tools will help you analyze the markets and individual assets. You can use the criteria you choose to search for possible trades.
This is professional-level software. It allows you to test your ideas and set technical criteria for searching the market. Some additional features cost extra, so make sure you understand what you get with the various versions.
This platform has more than 100 indicators you can use to evaluate potential trades. You can create alerts and watchlists and even get market news. However, it may be a bit advanced for those starting out.
MetaStock has more than 150 tools and offers an evaluation of what those tools indicate for a potential trade. This is for those who want to do a deep dive into technical analysis and all the possible indicators–including some you can create yourself.
Highly customizable charts and indicators make this attractive to those who are growing their knowledge.
This highly intuitive platform is a place to learn all your technical tools. It does not do the analysis for you, but it allows you to play with different indicators to see which you like best.
Do not rely on your memory to evaluate how you are doing with your trades. We all tend to have a favorable view of our performance. Keep a record of your trades and periodically evaluate them. Count your winners vs. losers and note if you are making money.
You have to have visual analysis skills. The foundation of technical trading is that all indicators are visual representations of what is going on with the market or an individual asset. Be aware that visual learning is not for all but can be helpful for those who like to picture things.
You must approach technical trading as both an art and a science. Any two traders might reach different conclusions from the same set of indicators.
You must be disciplined. Once you set a strategy, you must stick to it or make minor adjustments rather than switching to all new indicators every time you have a losing trade.
Many have done well with technical trading. Here are some examples.
John Paulson made billions when he shorted the subprime mortgage market on his brokerage.
George Soros is one of the most successful traders in history. He works in the hedge fund arena and made a billion dollars in profit when he shorted Pound Stirling in in 1992.
Jim Rogers, this head of Rogers Holdings had gains of 4200% when he read the technical indicators and predicted a bull market for commodities in the 1990s.
Technical trading is an approach, not a solution for all trading problems. Here are some things to watch for.
The most significant criticism is that traders tend to evaluate prices action without regard for the quality of the company. It is quite possible for a chart pattern to look promising when the underlying company is struggling.
Because there are many interpretations for technical indicators, some tend to overtrade, changing their strategies as they see new setups in a chart. This can lead to losses because there is no discipline.
There is a pulse to the market, a “feel.” It is easy to get out of touch with the times when your head is buried in charts all day.
So, what technical indicators should you use starting out? It is best to focus on two or three you understand and practice with those before learning the others. Starting with the RSI, MACD, and the moving averages is a good place to begin. Get used to these before branching out into more advanced tools.
Even pro traders select the few indicators that suit their style, so do not feel like you should use all of them. Experiment until you find the ones that produce consistent results for you.
Every trade has a “bid” price at which the seller will accept a trade, and an “offer” price that the buyer is willing to pay.
Technical analysis is not a gimmick. It is a well-established approach to trading. It has worked well for many–and it has failed for many. Do your due diligence and educate yourself. There is nothing “better” about technical analysis vs. fundamental analysis. The very best approach is the one that makes sense to you.
The intricacies of technical analysis requires time, practice, and a deep understanding of market dynamics. It’s a skill that evolves with experience, ongoing learning, and the ability to adapt to ever-changing market conditions.
Technical analysis in trading boils down to these 4 basic aspects:
The ‘head and shoulders’ resembles a baseline with three peaks, where the middle peak is the highest (the ‘head’) and the other two are of roughly equal height (the ‘shoulders’). The pattern indicates a bearish reversal.
Fibonacci numbers identify Fibonacci retracement levels. These levels (23.6%, 38.2%, 50%, 61.8%, and 100%) are mathematical points used to predict where a correction might end. It’s a tool embraced by many Wall Street traders for its precision and efficacy.
Stochastic indicators are momentum oscillators that compare a particular closing price of a security to its price range over a given period of time. A reading above 80 indicates a stock is overbought, and a reading below 20 indicates it is oversold.

