
July 26, 2022 Updated October 19, 2023
270
1 votes
Reading time: 1 minutes
When you learn to look for candle patterns in price charts, everything can seem jumbled. You can spend hours peering at charts, trying to identify patterns you may have read about. You need some simpler patterns. The Bearish Engulfing Candle pattern is a good place to start because it is a one-day pattern formed by a single candlestick. How’s that for simplicity? It can alert you to the possibility that an uptrend may be about to reverse. Learn how to find and use the Bearish Engulfing Candle pattern.

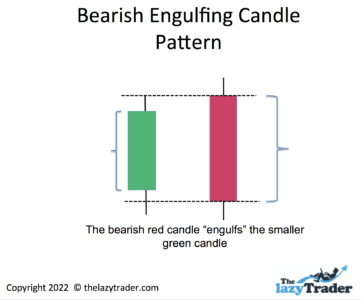
This pattern occurs at the top of an uptrend. You will see a candle that has a larger body than the previous day’s candle. The top of the body is higher than the previous day’s and the bottom is lower than the previous day’s.
Here is what one looks like close-up.
And here is what one looks like in an actual chart.
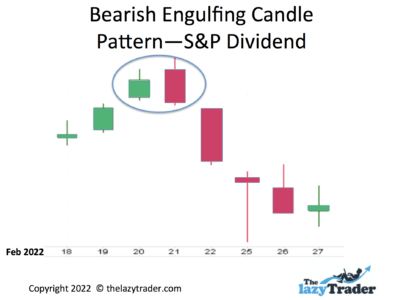
This Bearish Engulfing Candle Pattern occurred in S&P dividend stocks on February 21, 2022
The Bearish Engulfing Candle pattern suggests that prices may drop, as they did in this example, following the engulfing candle. Notice that this pattern is effective at the top of an uptrend. How do you know if it is the top? A Bearish Engulfing Candle pattern is your first clue.
No pattern works 100% of the time. And because this is a single-day pattern, it is slightly less reliable than patterns that take days and weeks to form.
Still, it can be a “wake-up call” to pay attention to prices in an investment you are watching. It is fair to say that the day you see a bearish engulfing candle pattern may not be the day you want to get out of a position you are in, but you can use it to prepare yourself for the possibility that you may need to sell soon.
Note that using charts to make your investment decisions is called “technical trading.” This is different from fundamental trading, which involves looking at the finances, debt, and overall fiscal health of a company. The Bearish Engulfing Candle pattern is definitely technical trading.
| Technical Analysis | Fundamental Analysis |
|---|---|
| Focuses on chart patterns and technical indicators | Focuses on company financial health, economic trends, and analyst forecasts. |
| Looks for trends. | Looks for company announcements and news. |
| May signal that it’s time to buy based on what other traders are doing. | Signals that a trader should stay in positions if the underlying fundamentals are still good. |
| Signals that it’s time to sell when other traders begin selling more than buying. | A sell signal will consist of dropping company profits or sales, as well as bad economic news. |
| Uses candlesticks to evaluate the price action in a day, week, or longer. | Evaluates profitability and company projections. |
The Bearish Engulfing Candle pattern has many advantages over fundamental analysis. However, it is not perfect, so be aware of the negatives as well. Let’s look at both.
This is a popular pattern that can give you a headstart on spotting a downward trend. Even if a company is doing well, its stock will fluctuate in value. This means you can catch some of those fluctuations a fundamental trader might not anticipate.
The bullish engulfing candle visually demonstrates that prices went both lower and higher at the close and open of prices that day. This is an objective view, as opposed to the “feeling” that though prices dropped, it wasn’t “that bad.” The fact that the candle engulfed the previous one indicates that buyers and sellers have been slugging it out to see who will win–and the sellers won.
The bearish engulfing candle pattern does not always work. Still, it has worked often enough that technical traders pay attention to it. It has a long history.
You can find charts that feature candlesticks quite easily. It is fair to say that most charting sites have an option to view charts as candles instead of simple lines.
And then once you find a candle chart, you can see the price action right in front of your eyes. The problem with merely following a line chart is that you see only where prices ended each day, not how they got there. Candlestick charts let you see formations such as the Bearish Engulfing Candle pattern to understand the multiple levels that prices hit during the day. You see that the price reached lower than the previous day and extended higher.
If you only tracked the trades as they came in, you would have a jumble of numbers. The Bearish Engulfing Candle pattern shows you the shape formed by all the numbers taken together. You can see the meaning behind the numbers at a glance.
Technical trading is not cold and clinical. It actually tells you the story of what other people are doing. You can look at the Bearish Engulfing Candle pattern and create a tale, such as, “Buyers tried to move prices higher, but more sellers came in, driving the price lower than the previous day’s close.
Despite the pluses for the Bearish Engulfing Candle pattern, you need to watch out for some of its weaknesses.
You cannot expect a one-day pattern to foretell prices accurately for the coming days and weeks. Be aware that the pattern has a history of predicting downtrends, but not always.
It’s not the end of the world if you don’t notice the Bearish Engulfing Candle pattern on the day it forms, but it does only last for a day. If you don’t check your charts every day, you could miss the beginning of a downtrend. Do not panic. There is time to act in the days after this candle. Just notice that it formed and look at what the market has done since. Did prices continue to drop?
The news can derail a new downtrend. If a company suddenly announces better-than-expected earnings, or a competitor stumbles, prices could leap upward. Never think you “have it made” because you spotted a Bearish Engulfing Candle pattern.
The motto of technical traders is “trade what you see, not what you think.” They let the charts tell them what to do, instead of listening to pundits and “experts.” And they avoid making emotional decisions or overthinking what a chart shows them.
Here are some prominent technical traders.
Jim Rogers
Rogers became famous for predicting the bull market in commodities in the 1990s. He gained more than 4200% by investing based on that trend. Though the Bearish Engulfing Candle pattern is used for predicting when prices will go down, the principle is the same.
Steve Nison
Nison worked at E.F. Hutton and began using technical analysis more than 30 years ago. He introduced candlestick trading to the West. He began focusing on technical analysis some 30 years ago and has used candlesticks-including the bearish engulfing candle pattern–to decide when to buy and sell.
Today, many admire technical trader Jack Schwager. HIs book Market Wizards talks about using the Bearish Engulfing Candle pattern.
Another current technical analyst who is widely admired is Sudarshan Sukhani. He the bearish engulfing candle pattern. He’s president of the Association of Technical Analysts. The Bearish Engulfing Candle pattern is part of his arsenal.
Munehisa Homma invented candlesticks nearly 200 years ago. In today’s dollar, he makes $10 billion trading rice using candle patterns.
You could argue that there is an infinite number of types of this pattern based on the fact that the height and depth could vary, but it is more practical to say there is only one such pattern. The red body of the candle is larger than the previous day’s candle. Add the fact that this needs to occur at the top of an uptrend, and you really only have one Bearish Engulfing Candle pattern to watch for.
You have some choices for trading this pattern. Once you learn how to read it and combine it with other patterns, you can increase your chances of success with it.
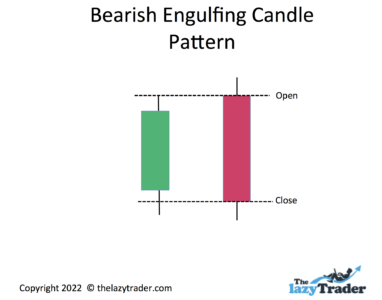
This pattern is fairly simple to read, but you need to pay attention. Notice that the body is what you go by. The body MUST extend higher than the body of the previous day’s pattern. And it must also extend lower.
 ARTWORK
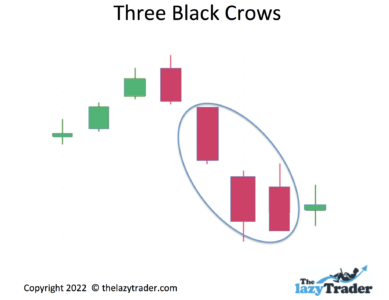
You may also see a related pattern that forms after the Bearish Engulfing Candle. This pattern is called the Three Black Crows pattern.
 ARTWORK
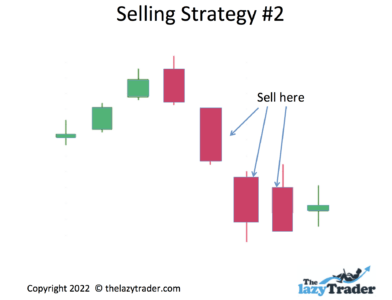
Notice that the Three Black Crows confirm that the downtrend is developing.
There are a couple of approaches for getting in and out of this trade. Let’s look at the possibilities for a strategy.
Trade entry
In this case, “trade entry” means selling the position you already hold. You “enter” the trade by placing a sell order.
Let’s look at some choices.
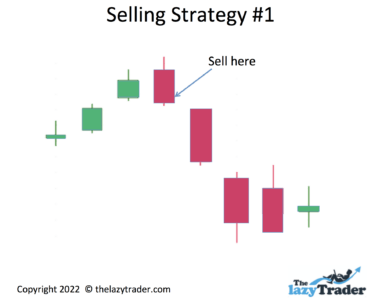
This approach gets you out of the position as early as possible, potentially saving you from losses. However, if prices go back up, you won’t earn profits from the rise.
Trade exit
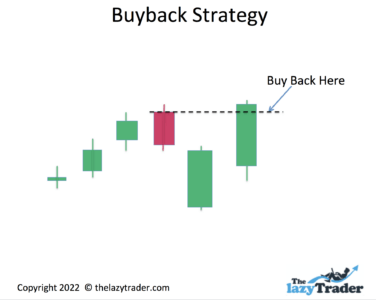
Exiting this trade would mean repurchasing the position. Suppose prices bounce back and close above the previous high. In that case, you may consider buying the position again in hopes that it will continue to rise.
Trade management
Always pay extra attention during the period when you buy or sell. Be prepared to make changes by adjusting the position size.
For example, if you don’t feel sure that a downtrend will occur, you may want to sell half of your position so you will still own some of it if prices go back up.
Or, if you decide to buy in because prices have gone back up, you may want to buy half as much as you previously owned, just in case the trend turns against you again.
Your overall strategy should include constant learning about candlesticks, technical trading, and engulfing patterns. Here are some suggested resources.
Trade What You See How to Profit from Pattern Recognition by Larry Pesavento
Recognizing patterns is the heart of technical trading, and this includes the bullish engulfing candle pattern. This book helps you identify patterns as they develop and explains how to trade them.
Trading In The Zone by Mark Douglas)
A good source for eliminating bad habits and remaining consistent in your strategy. You learn to trade probabilities and ignore anomalies.
Thomas Bulkowski’s Encyclopedia of Candlestick Charts.
This is a good reference work, so you can look up patterns s needed.
The Complete Guide to Candlestick Charting by Alan Northcott
The book offers strategies that go with candlestick chart reading.
Courses on technical trading almost always include sections on the bearish engulfing candle pattern. Avoid courses that promise outlandish returns.
Udemy Technical Trading
Udemy is a reliable source for quality courses. This is an excellent place to learn not only about candlestick patterns but also broader aspects of technical trading, such as moving averages, trends, and how to use daily volume in your considerations.
Travis Rose
Recommended for beginners. Learn the basics of analyzing patterns.
Bullish Bears
Bullish Bears offers learn-as-you-trade skill building. You do not have to trade actual money because you can make paper trades.
Use blogs to stay abreast of current techniques, but also use their archives to learn. Follow the trades a blogger recommends to see how they work out.
Adam H. Grimes
The appeal here is that you can spot patterns in the current marketplace. Grimes walks you through trades.
Top-Down Charts
Learn the relationship between microtrends and macrotrends. The bearish engulfing candle pattern is a microtrend because it occurs on one day. See how it relates to larger trends and market dynamics.
Marc to Market
This is a Forex blog. Technical trading principles apply to Forex just like any other asset.
Forums can be a source for learning from others, but remember that not every trader giving advice is successful.
Elite Trader
Elite Trader provides forums on every trading style, including candlestick trading. Look at the general technical forums, and then explore niches that appeal to you.
Morningstar
You get high-quality input from traders here. Still, remember that not every opinion is reliable.
Look for newsletters from seasoned pros. A good newsletter will give you tips and specific recommendations.
The Technical Indicator–Marketwatch
This newsletter will get you right to the heart of technical chart analysis. You will use current-market setups and follow how they play out.
Trade-Ideas Strength Alerts
Learn about the Relative Strength Index. This vital indicator can help you assess patterns, such as the bearish engulfing candle pattern.
Morningstar Investor Newsletters
There is such a wide variety of newsletters here that it is recommended that you focus on your narrow interests before branching out.
Choose a podcast based on the podcasters’ credentials and track record. Make sure the podcast is not merely a sales tool.
Allstarcharts Podcast on Technical Analysis Radio
Here you learn about current patterns that are developing in the marketplace.
Charting Wealth’s Daily Stock Trading Review
This podcast follows the live markets and provides analysis of what trends are developing and are likely to develop in the following week.
YouTube can be a free-for-all, with many untrustworthy opinions. Choose carefully and ensure that the advice makes sense to you.
What is a Bearish Engulfing Pattern by Rayner Teo walks you through trading this pattern. It offers excellent visuals and provides tips on some of the finer points.
Bearish Engulfing Candlestick Chart Pattern Interpretation by UK spread betting provides an in-depth look at how to read this pattern.
Webinars can be thinly disguised sales pitches. Make sure you learn nuts-and-bolts information.
Online Trading Academy
A reliable source and a thorough walk-through of technical trading.
Technical Analysis–Fidelity
Fidelity’s webinars are high-quality. Choose the series that explains candlestick patterns.
The most significant factor to consider when looking at this pattern is how comfortable you are making a decision based on one day’s trading. Are you the type that prefers to see a longer trend develop before you buy or sell?
This is a one-day pattern. That means you should be prepared to watch charts every day.
Prepare yourself to be wrong—plan to adjust your trade amounts according to how the market follows through after this pattern. You may also need to sell a position early just because you are uncertain.
Do not nervously try to outguess the market. Use the Bearish Engulfing Candle pattern to increase your chances of success, but do not view it as a shortcut or gimmick. Take a slow, level-headed approach to creating wealth.
Even experienced traders make mistakes. Never put more than 1-2% of your trading account value into any single trade.
Traders have used the Bearish Engulfing Candle pattern for a long time. Set your trading rules and stick to them, and this pattern can serve you well.
Track how you are doing. Enter each trade in a journal, or use the trading history on your trading platform to tally up how many winners vs. losers you have. This is one more way to remain objective about your strategies. Are they working?
Look for a platform that offers candlestick charts. Here are some:
This platform allows traders to communicate like you do on Twitter and Facebook. You can share trading ideas and experiences with other traders. For example through social trading.
Ava offers platforms for multiple experience levels. You can automate your trades and follow expert traders to learn from their insights.
This platform is not available in the U.S. naga allows you to copy the best traders on The platform. You can trade stocks, cryptocurrencies, and Forex across the world.
This forex and CFD broker makes it easy for traders to get started quickly.
FP uses the Autotrade tool, which allows traders to copy trade. It offers live statistics, along with risk-management systems. You can see the entire trading history of the most successful traders and mimic their methods.
The platform allows a low minimum deposit. Those trading for the first time can get started here. A free demo is available.
Reversal Pattern – This refers to any pattern that suggests a trend is over and the opposite trend is beginning. There are several such patterns, including the Bearish Engulfing Candle pattern.
Bearish – This means traders anticipate that prices will go down. This can apply to a single asset or the market in general.
Bullish – Traders think prices will trend upward.
Engulfing Candle – A candle “engulfs” another when the body reaches both lower and higher than the previous day’s candle.
Downtrend – Prices slope downward on a chart. This can be interrupted by some up days, but the overall trend should be lower. The longer a trend, the more reliable it is.
Uptrend – Prices generally move upward. This can be interrupted by down days, but you should be able to clearly see a series of rising days.
Stop-loss – A stop-loss order sells your position automatically if the price drops to a level you have designated. You can choose either an exact price or a percentage loss where you want to automatically sell.
Trend line – This is an imaginary line you draw the line access the lows for an upward trend and across the highs for a downward trend.
Gapping Down – This is a sudden drop in a price with no gradual trend. Instead, the asset will open lower with no intervening trades.
Volume – This is the number of shares exchanged each day–most charts display a graphic representation of each day’s volume. A Bearish Engulfing Candle with high volume has a better chance of being accurate.
The bearish engulfing candle pattern can have a place in your toolkit of technical trading indicators. No technical trader should make this the only tool. Used in conjunction with a broad knowledge of candlesticks, trends, reversals, and other indicators, it can serve you well.
If you already own a stock and you see a bearish engulfing candle pattern, you should be alert for a possible drop in the value of your position. However, if you have been wanting to buy the stock, you could see the potential drop in prices as a buying opportunity.
If the market follows through, prices will decline. Watch for a downward trend to develop. Note that this is not guaranteed. The pattern can fail, and prices could go up instead of down.
This pattern is accurate about half the time. It becomes more reliable if you wait to see if the market follows through during the three to four days after the pattern.
Any trend reversal is powerful. The catch is that this pattern does not always succeed. If you already own a position and it turns downward in price, rely on your sell rules so that you don’t fall prey to the power of a trend reversal.
The biggest risk is panic selling. When you see a Bearish Engulfing Candle pattern, don’t panic and sell. Maintain your selling rules, either through stop-loss orders or through watching for levels you have set. As a compromise, you could take some of your profits and leave part of your funds in the position to see if it turns upward again.

