by Louis H-P
August 27, 2021 Updated August 1, 2023
627
1 votes
Reading time: 13 minutes
Price action trading utilizes the movement of a security in your portfolio to take advantage of future price movements. Price action is the foundation for all technical analysis. It can be highly advantageous if used correctly. This article will give an insight into how price action trading works. We will also display some of the common strategies used.

The firm's main research and development office is based in Tel Aviv Israel. It originally specialized in Forex and indices spreadbetting and CFDs but has recently expanded in stock trading also. At the time of writing, eToro has 2.2 out of 5 star on Trust pilot. The comments suggest that the platform offers some impressive features but withdrawing money can be difficult. Having said that, some of the negative reviews appear to be rants rather than constructive criticism. This can be examples of traders losing money through their own recklessness rather than eToro's fault. You should therefore take this reviews with a pinch of salt. OANDA is a global financial services company providing advanced currency solutions to both retail and corporate clients all over the world. In this article, we are going to review this broker’s trading options, tools, platforms, spreads, commissions, security measures, and educational resources to help traders make the right choice. AvaTrade offers a wide variety of trading solutions (spread trading, CFDs, and social trading), and peace of mind with its comprehensive regulation, covering the EU, Australia, Canada and South Africa. Clients can use a variety of platforms for discretionary and automated trading.![]() Best Award Winning Brokers
Best Award Winning Brokers Show Search Filters
76% of retail investor accounts lose money when trading CFDs with this provider.
76.6% of retail investor accounts lose money when trading CFDs with this provider. You should consider whether you understand how CFDs work and whether you can afford to take the high risk of losing
76% of retail investor accounts lose money when trading CFDs with this provider.
Price action trading is when a stock or security is plotted against time. Price action analysis involves analyzing candlestick chart patterns and pin bars and trading based on the pattern to earn profits. It is generally depicted in the following ways:
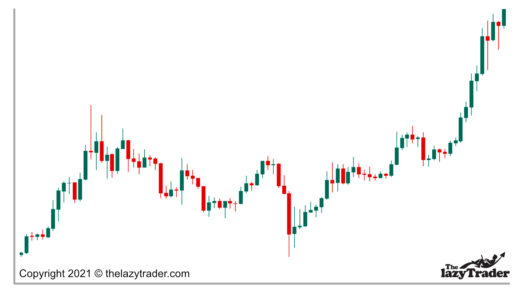
For short-term technical traders, price action signals are reflected for shorter time intervals. You can quickly spot trading patterns using price action. Price action is used for trading in equities, Forex, commodities, and cryptocurrencies.
A study by Alanzi & McMillan covering the Forex trading market between 2000 and 2018 was compelling. It found that observing candlestick patterns was worth it. Combining this with analysis to identify strong technical signals could have helped achieve returns to the tune of more than 600% over the 19-year period.
Price action forms the basis for technical analysis. Many disciplined traders rely on price action for their Forex market strategies. In addition, these traders are dependent on trend and momentum analysis. This relies more on price action.
Those who participate in scalping and swing trading, and who trade on technical and fundamental analysis, are also influenced by price action before seeking a position. Sometimes, technical indicators could be unreliable since these indicators are a derivative of price.
However, price action and price action trading are more reactive. They are often used by retail Forex traders in conjunction with other tools available for technical analysis. Price action trading can also be used by new traders who are just beginning. This is due to it being less complicated than complete fundamental analysis.
A trader needs to observe the financial markets and look out for any pattern created to make their trading decisions – such as higher highs, higher lows, lower highs or lower lows.
Similar to other trading tools, price action should likely not be used in isolation. Traders should also look out for volume indicators and other sentiment indicators. These can help contribute to a future security price.
For example, if a stock has witnessed a breakout, it does not guarantee that the price will appreciate further, and it might take corrective action in the opposite direction. This is known as a retracement or pullback to a previous resistance area.
Any critical developments on the stock’s price change, like a big earnings beat or miss, should also be observed. This should be compared with the indications suggested by price action.
Sometimes the pattern can be challenging to follow or interpret. The experience of a successful trader can be essential in how successful the trade turns out.
Price action indicates the future price. The keyword here is “indicates.” Like other trading strategies, price action trading does not guarantee that the prediction will always be correct.
Based on price action, a trader can seek a position, but the price could move in an unfavourable direction. What works in favor of price action is that it is a leading indicator. Most technical indicators are lagging in nature. Examples include Relative Strength Indicators (RSI), a stochastic indicator, Moving Average Convergence Divergence (MACD).
To illustrate, suppose the price is constantly trending upward. Immediately you will see the movement reflect in the price. With the 200-day moving average, the upward trend will take some time to reflect in a moving average. This is because it is still under the influence of historical prices. By the time the moving average hints at an uptrend, the trend could have reversed.
It is equally important to learn when to accept a loss and close out a position. This can happen when price action Forex day trading strategy does not work. This is better than holding on to a losing trade for too long. Guaranteed information is not provided by price action. Do your due diligence, aim to be correct on average, not all the time.
Understanding the different patterns based on which price action trading can be carried out is invaluable. While there are many such patterns, one generally specializes in a few and leverages these market trends.
One should also interpret the charts and determine if the price is consolidating or trending in a specific direction. For example, a support level is a price point where buyers are expected to increase the asset’s price. This is often based on strong trend lines or support levels. When a price is expected to fall, it meets a resistance level, where sellers come into play.
Traders can use price or could use the help of candlesticks to identify high-probability trades. Depending on if you are a short-term trader or a long-term one. You will need to decide the time interval.
Every strategy should assess the risk-reward relationship. If the risk is too high and the return is too low, then the strategy should not be pursued. A popular way to assess is the risk-adjusted return. Thus, only those trades that have a high expected risk-adjusted return should be selected. The risk-reward ratio can help you in this.
Good traders follow a rule that only 1-2% of their capital is put at risk for any individual trade. This ensures some margin of safety, and that traders do not lose out a large amount in a single position. A few large losses could be enough to wipe out a significant amount in a trading account.
One way to ensure that a trader does not lose large in a single trade is by establishing a stop loss level. A stop-loss is a sign of a disciplined trader who is willing to accept that the trade did not go as planned.
Such a control mechanism prevents a free fall and limits the loss. The market can be humbling at times. Having proper risk protocols in place can be as valuable as finding high-return strategies.
It is equally important to understand when to exit a trade when it is profitable. A trader can get carried away emotionally and expect the profits to rise further.
The price level at which to exit should be determined while adopting the strategy. A trader should exit once this level is reached. Much like establishing stop-loss levels, profit-taking is essential for long-run success.
The first step is to analyze the price chart and determine if any pattern is developing, looking at swing highs and swing lows of the price action. Depending on the type of pattern, a trader must determine what the expected price is going to be, stick to their trading setups, then execute the trade if everything aligns.
Once this price is determined, the trader must also select a stop loss level based on the entry point. The next step is to enter into a position. The position size should not lead to a loss of more than 2% of the portfolio.
The trader should monitor the position and also keep track of any macroeconomic developments. Most platforms would have a section dedicated to the latest news. The position should be exited once the target price or stop loss level is reached.
Fundamental trading involves determining if the asset’s current price is overvalued or undervalued. If the market price is lower than the intrinsic value calculated, then you can buy at a discount! A trader would buy this security.
Thus, fundamental trading looks to exploit opportunities in mispricing. On the other hand, price action traders only consider the stock market price without going into the nitty-gritty of the asset’s intrinsic value.
Since market price is readily available, price action trading is a more straightforward approach to trading. It has been seen that individuals are prone to judgment errors while processing a large amount of information. Price action focuses on a single data source or price.
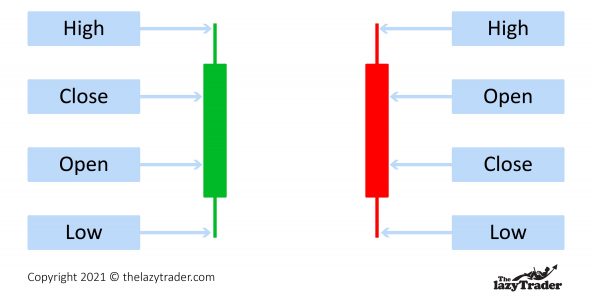
Candlesticks provide more information than simply price. The opening price, closing price, high and low are depicted in each candlestick. Depending on whether the price was higher or lower, the candlestick is colored in green or red.
The figures above show the two types of candlesticks that are plotted. Sometimes the green color is replaced by a blank box, and a black candlestick is used as an alternative to the red one.
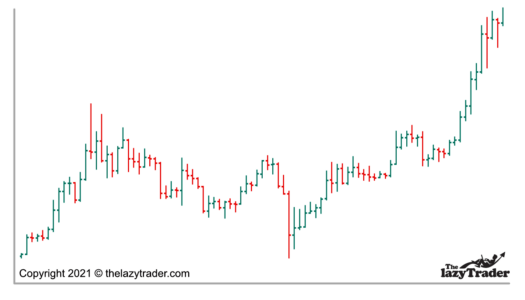
OHLC stands for Open, High, Low, and Close. The OHLC bars show the same information as candlesticks but in a different way.
Each point on an OHLC chart consists of a vertical line and a horizontal line. The vertical line indicates how volatile the price has been and shows the intraday range. The longer the vertical line, the higher the volatility.
The horizontal line extends to the left and to the right of the vertical line. These horizontal lines show the opening and closing prices.
The red line indicates that the closing price was lower than the opening price and for the green line, the closing price is higher.
In a continuation pattern, the trend is expected to remain the same. For example: the price will increase if the trend is upward or decrease if the trend is downward.
When the price crosses an upper trendline in an ascending triangle, the trend is expected to continue further.
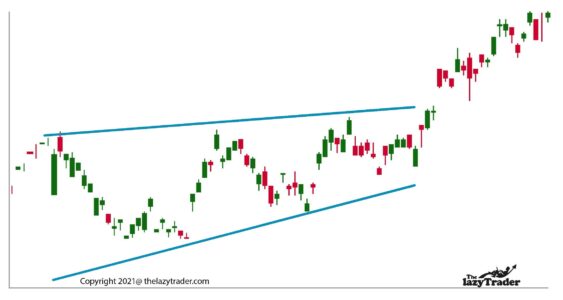
As seen above, as soon as the price rises above the upper trend line, there is a breakout. However, it should be observed that leading up to the increase, there is a gradual increase in the level of the lower trendline. When the upper and lower trendline coincide, the breakout point is reached.
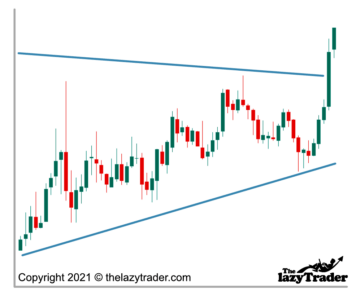
Sometimes the market may be in a consolidation phase. It means that there is no significant movement in the price, and the trend is sideways.
During such a movement, traders are generally not sure whether to buy or sell.
And at some point, there tends to be a breakout, and the action can be in either direction. In the example provided above, a bullish pennant has taken place, and the price increased sharply.
With experience, you will get better at understanding these.
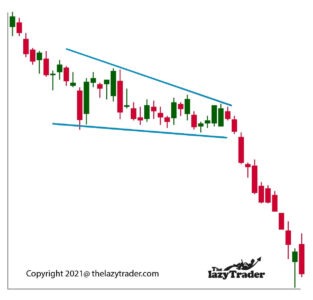
Similar to an ascending triangle, when the price falls below the lower trendline, it is an indication that the price would drop further.
Such a pattern is often interpreted as an option to short the asset or sell it. It has another name: bearish triangle. As the price breaks the lower trendline this is an indication that the momentum is heavily to the downside.
Other traders may join in a short, causing the downward momentum to accelerate further. Trading the descending triangle gives the trader the chance to make large profits over a short period of time.
There is a risk that the price does not continue on its intial downward spiral though. The more often a price touches resistance levels, the more reliable the pattern.
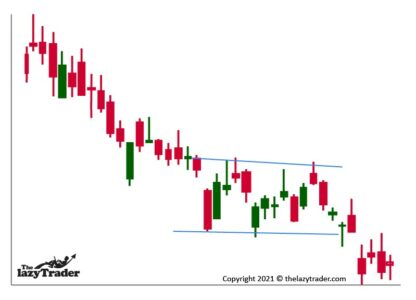
In a rectangle pattern, there is a period of consolidation, and the price trades sideways. The support and resistance level during a rectangle is flat. Once the consolidation period is over, the price tends to continue on its bearish path.
This is considered a continuation pattern as although the momentum pauses for a brief time, it eventually continues on its downward trajectory. As the price moves up and down in between the support levels, it is considered that there is no trend. The rectangle disappears when the price breaks through the lower trendline.
This is similar to a bullish pennant. The only difference is that there is a drop in price after a period of consolidation.
In a reversal trading pattern, there is a break in the trend. For example, if the price is trending upward, a reversal pattern would predict a drop in the price.
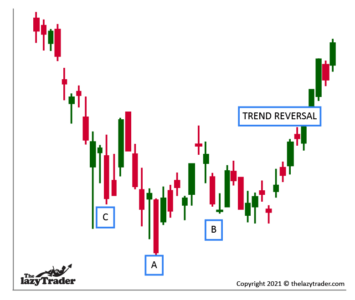
In a head and shoulder pattern, there are three peaks. The highest one is the head, with the lower peaks on either side referred to as shoulders. Now for a bullish reversal pattern, the head and shoulders are inverted, and the head has the lowest price point.
This pattern is observed after a downtrend and signals a reversal to an uptrend.
If you are able to spot this pattern developing you can potentially position yourself ahead of the trend reversal. The head and shoulders pattern is considered one of the most reliable trend reversal patterns. It is a good example of the battle between bullish and bearish traders.
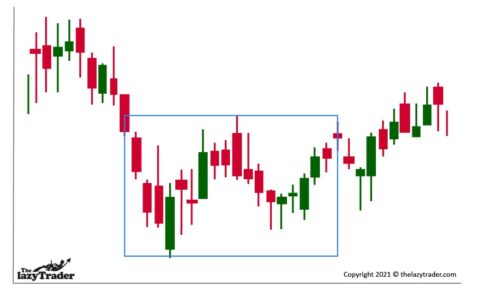 The double bottom can be observed in a downtrend and is shaped like a W. The two bottoms in the figure highlighted above act as a support level, and the price has increased after the support is touched twice. The double bottom is a chart pattern which highlights a momentum reversal due to a change in trend. It can also be described as the battle between bullish and bearish traders, before the bulls gain the upper hand.
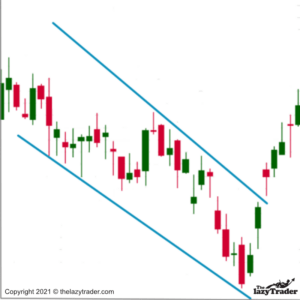
A descending wedge pattern is observed when both the trend lines are sloping downward. Since both the trend lines are sloping downward, it can be interpreted as a downtrend, but the price increases after the wedge pattern completes and breaks out to the upside.
Essentially this pattern displays a price reversal which is this case was descending before becoming bullish again.
As per the ascending wedge, this chart pattern is looked out for by traders seeking a price reversal. This allows traders who are willing to risk this perceived pattern failing in order to position themselves ahead of the breakout.
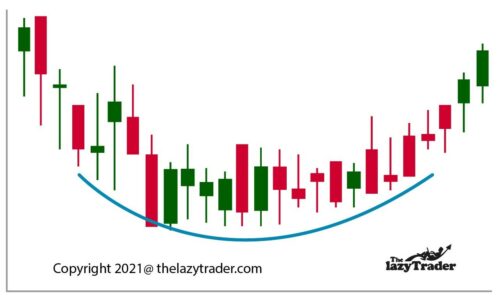
The pattern formed is like U after a downtrend. After the shape is formed, the price tends to trend upward.
A rounding bottom pattern is a reversal chart pattern. It starts off as a bearish move, but a slowly developing one. Eventually, without necessarily bouncing on any resistance level, it recovers into a bullish move. The time frame for this pattern is not set, but usually takes a while to develop.
First, in a bearish head and shoulders pattern, an uptrend is observed, followed by a head and should pattern. Consequently, there is a drop in the price, indicating a reversal in the uptrend pattern.
The resistance level is touched twice before the price begins to drop after an uptrend in a double top. It can be considered the opposite of the double bottom, so this pattern has an M shape.
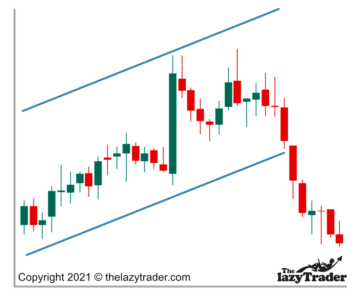
In an ascending wedge, the trend lines slope upward, and after the pattern is formed, one can expect the price to be bearish. As with the bearish wedge, this pattern displays a price reversal which in this case was appreciating before becoming bearish again.
Many traders will look out for this pattern as a sign that a price reversal is about to start. As a result, traders will use this pattern to go short in advance of the downside move so ensuring they capture it to its fullest. As with all technical trading, sometimes the pattern does not necessarily follow through as you expected.
An inverted U pattern is formed after an uptrend, following which the price trends downward.
A trending market is one in which the price continues to follow the trend. If the trend is upward, the price will increase, and if the trend is downward, the price will fall.
A breakout occurs when the price exceeds the resistance level or falls below the support level, which offers trading opportunities. A breakout can be considered a turning point and traded using the bullish triangle or bearish triangle. One could expect the price to rise or fall sharply.
When the price reaches its support level, the price is expected to increase (bounce). Likewise, the price is set to drop once the resistance level is reached. A trader can buy in the first scenario or sell in the latter scenario. In a trending market, the resistance and support levels keep changing.
For a market trending upward, the support and resistance levels keep increasing. The resistance could subsequently turn into a support level. Once the support level is breached in a trending market, you should look to exit your trade.
In a range-bound market, the price trades within a range. Unlike a trending market, there is no definite direction towards which the price is moving. These can be difficult to identify future price movements in. These tend to react swiftly once a breakout occurs.
A bullish or a bearish pennant is an example of how a trader can use a range bound market. Similarly, there is a definite trend observed in a rectangle after the consolidation phase. A trader can use this to execute a trade.
Unlike a trending market, the bounce is observed in a narrow price range in the case of a range-bound market. Such a strategy can be employed when the price is less volatile and tends to oscillate within a range of prices. Like a trending market, trading a bounce in this market involves selling when the resistance level is reached and buying at the support level.
Below content does not apply to US users . It is one of the most user-friendly platforms that allows traders to connect with other traders. Etoro is regulated in several jurisdictions. It supports over 1,000 assets that include CFDs and cryptocurrencies. As a part of its social trading initiative, beginners can replicate the trades of experienced traders. This is one of the reasons why Etoro has gained popularity. This is prevalent among traders who do not have much experience.
eToro is a multi-asset investment platform. The value of your investments may go up or down. Your capital is at risk.
Operating in a more specific niche, AvaTrade offers international forex brokerage services. It supports a host of trading platforms. Examples include MetaTrader 4, MetaTrader 5, MetaTrader for Mac, and the MetaTrader mobile app. Clients only have access to automated trading tools. Examples include: RoboX, Mirror Trader, MQL5 Signal Service, API Trading, and Duplitrade.
It may be one of the new players, but NagaMartkets offers a host of attractive features for traders. It offers unlimited trading in crypto and fiat currencies and that too without any commissions. Through the NAGA card, it offers 24/7 free withdrawal of funds. It also has a wallet for the safe storage of currencies. NagaMarkets is also a platform that promotes social trading through its algorithms. This helps to identify the top traders.
It specializes in foreign exchange and CFDs. It has a very simple process to open a trading account. In addition, users can assign a proportion to the capital that can be traded while replicating a trader. You can follow any number of signal traders.
FP Markets uses a segregated client bank account. As a result, it is one of the most trustworthy options. In addition, the Myfxbook option for reporting client’s performance is transparent. This makes it one of the best tools for reporting. FP Markets has additional features. This includes real-time statistics, risk-management systems, and management of trading systems.
This is the best platform for someone unsure about trading. The minimum deposit required for an account is low. It also offers a free demo simulation account. Users can also rank the traders based on parameters like the Sharpe Ratio. The amount of trade activity or average trade duration is also available. After this, the user can select a signal provider of his choice and replicate the trades.
Price action trading is straightforward for everyone. Even someone without any prior experience can start within a few weeks. Demo accounts do not require funding. This can give you confidence. Despite being simple, price action trading offers flexibility.
As Larry Pesavento, renowned price action trader, notes, “reliable and repeatable patterns present excellent profit opportunities, but focusing on risk, not potential reward, is the “secret” to pattern recognition trading.” As a result, price action trading can give you an edge in your predictions. It can also help you protect your downside risk in risky trades.
Finding the best price action trading strategies can give you an advantage in your daily decisions. So do your research, find the proper set-up, and execute trades for profit.
To use price action trading, study historical price data and identify patterns or trends that signal potential market moves. Then, combine this analysis with risk management techniques to make informed trading decisions.
To read price action, closely observe candlestick charts to identify patterns and trends in the market. Focus on key support and resistance levels, along with trendlines, to better understand market sentiment and make informed decisions.

