- What is the Morning Star Candlestick Pattern candlestick pattern?
- Does the Morning Star Candlestick Pattern candlestick pattern actually work?
- Key Differences between technical and fundamental analysis
- What Are The Advantages and Disadvantages of Trading with Morning Star Candlestick Pattern?
- Examples of famous traders who use the Morning Star Candlestick Pattern candlestick pattern
- How many types of Morning Star Candlestick Pattern candlestick patterns are there?
- How to trade a Morning Star Candlestick Pattern candlestick pattern
- A Morning Star Candlestick Pattern candlestick pattern trading strategy
- What are the Morning Star Candlestick Pattern candlestick pattern trading platforms?
Learning how to trade the Morning Star pattern can improve your success in investing in the financial markets. This pattern is one of several candlestick patterns you can see on a price chart. Once you learn to recognize it, you will be able to anticipate when prices will reverse course and rise.
What is the Morning Star Candlestick Pattern candlestick pattern?
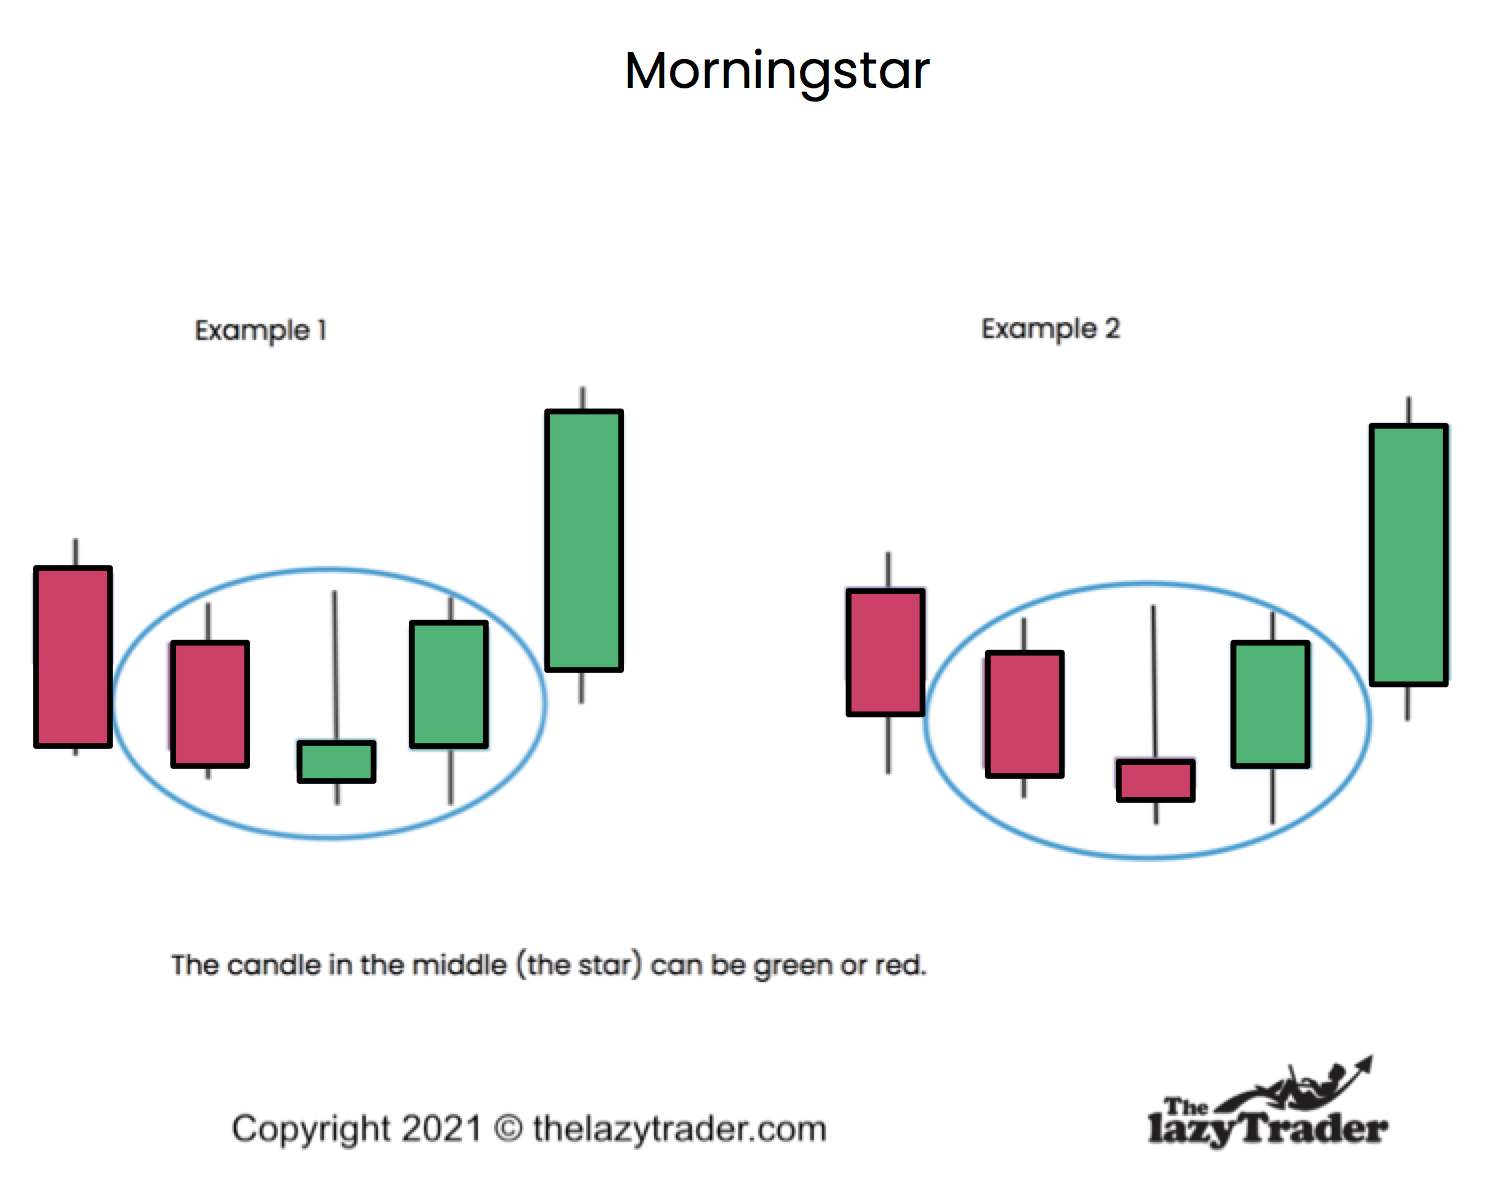
This three-candle pattern forms over a period of one to four days and occurs after prices have been in a bearish downtrend. It signals a possible bullish reversal in price direction, meaning prices may be about to rise and start a new uptrend.

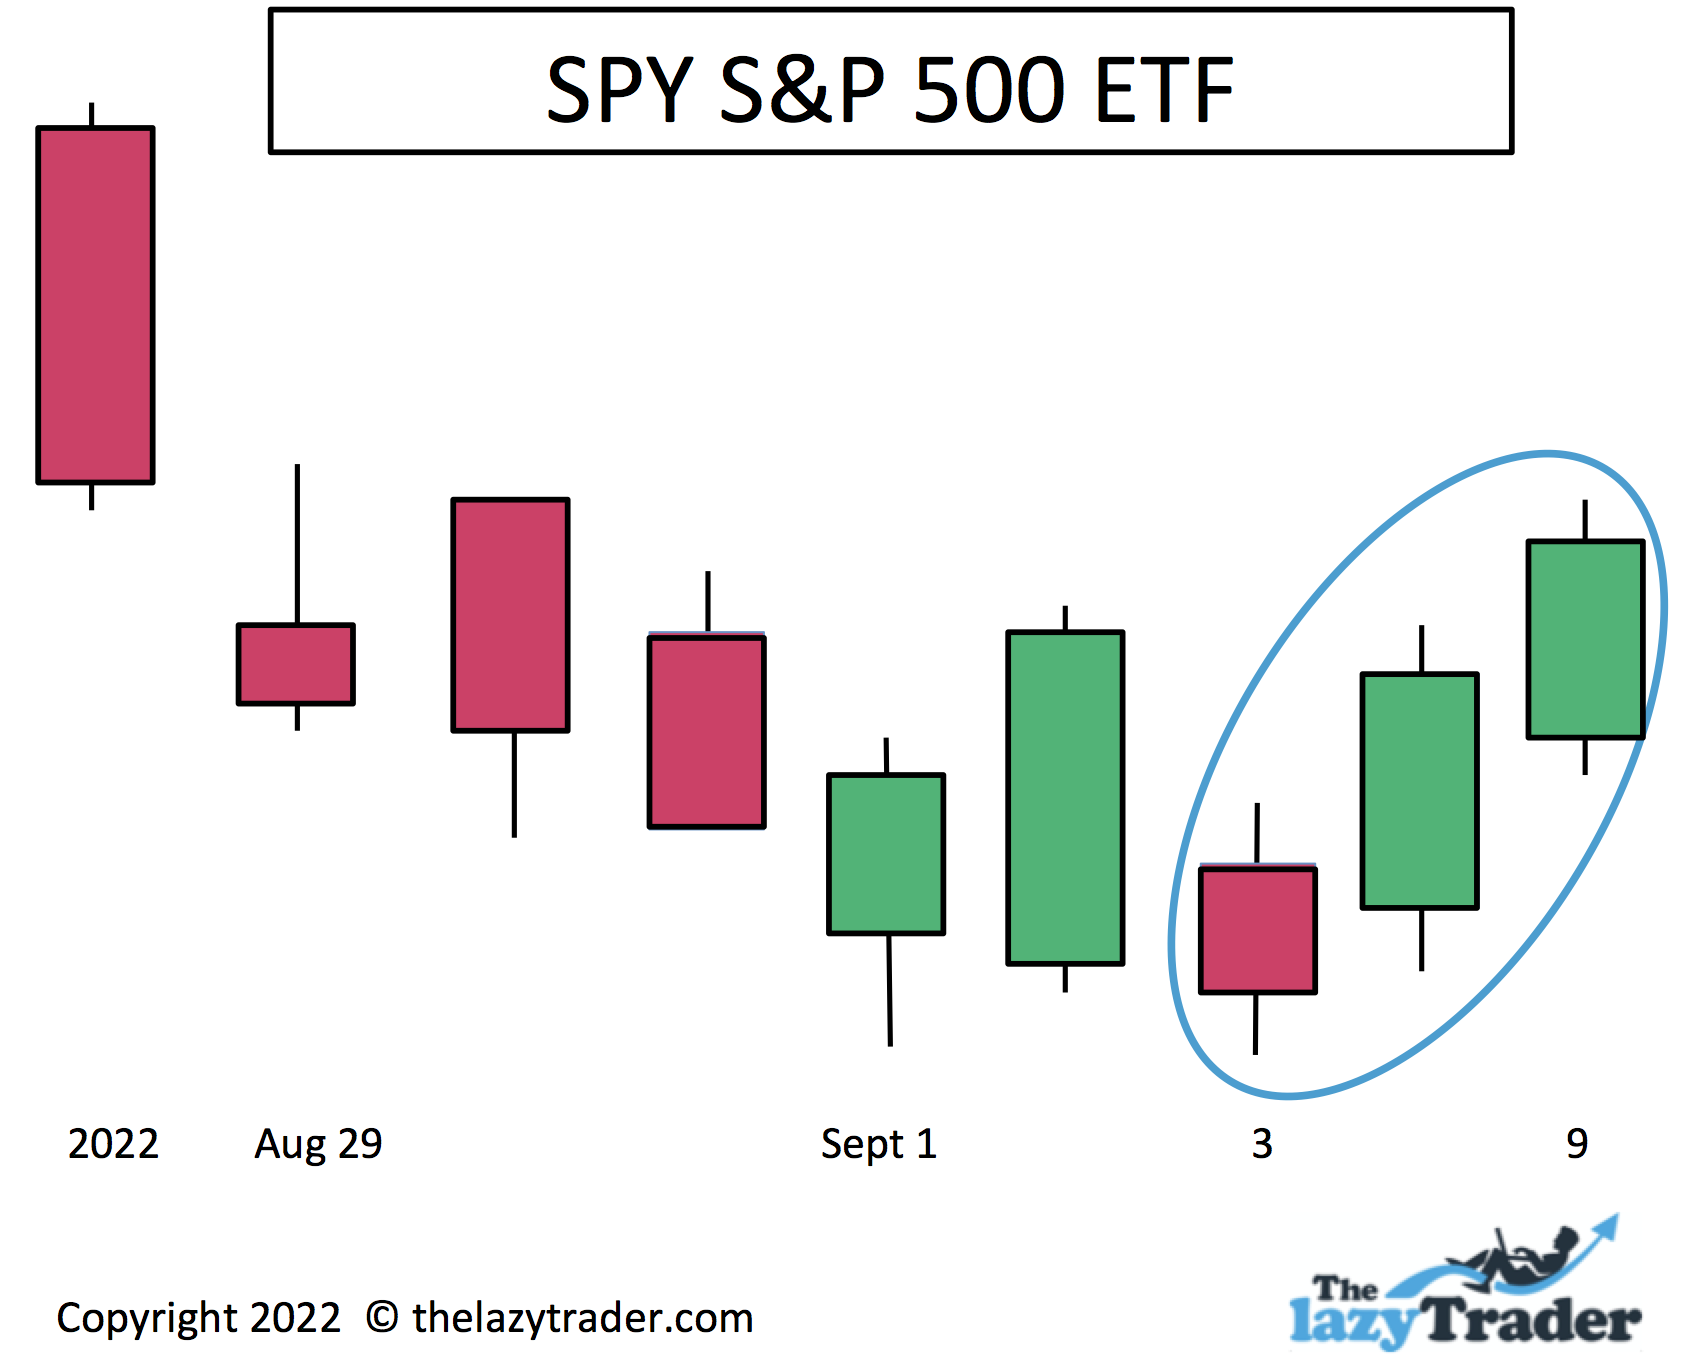
Here is an actual Morning Star bullish reversal pattern that occurred in the S&P 500 in Sept. of 2022
Does the Morning Star Candlestick Pattern candlestick pattern actually work?
The Morning Star is considered one of the most reliable patterns in trading. It is accurate between 70% and 80% of the time. It is most accurate when investors wait for the third candle that moves up after a bottom. This is the most bullish candle of the pattern.
Trading patterns are part of technical trading. This type of trader watches charts for signals about price action. A fundamental trader examines a company’s sales, profits, growth, and other factors to decide whether to invest.
Key Differences between technical and fundamental analysis
Fundamental Analysis
Fundamental analysis means examining the company’s past, present, and future. A fundamental trader would look at past growth, current debt, and sales projections. He would also evaluate management and look at how the company is doing against competitors.
The most notable fundamental trader is Warren Buffet. He examines company fundamentals and looks for “value stocks”-those below fair value.
Technical Analysis
Technical traders won’t ignore a company’s health, but they focus on price momentum and reversals. Certain patterns have been proven to predict the near future of prices, and technical traders follow those trends.
Candlesticks are a visualization of price action, represented by a drawing that shows the open, close, high, and low for any asset. Technical traders use these candlesticks to evaluate price patterns. A word about the reliability of the Morning Star pattern: the pattern is not 100% reliable.
What Are The Advantages and Disadvantages of Trading with Morning Star Candlestick Pattern?
Objective trading
The Morning Star pattern eliminates the need to fret and guess. When you see the pattern, it’s to evaluate your decision on whether to buy.
Proven technique
The Morning Star has been in use for centuries. It is tried and true and will continue to be used for a long time to come.
Accessible and easy to understand
You do not have to search widely for a charting service that shows candlestick representations. Most chart sites offer candlesticks. You can read candlesticks easily on these sites, with little instruction.
Clarity
Seeing a picture of what is happening to prices beats hearing or reading about it. You can see how prices behaved and do not have to imagine what happened.
Helps traders understand the psychology of the market
You can see what people are thinking. For example, you might realize that buyers thought the price would go up, but sellers decided to take profits, and their selling drove the price down. You can see a consensus developing.
Weakness as an indicator
Though a Morning Star pattern has high reliability, it can fail. Never pile into a trade just because you see an indicator. This pattern can and does fail.
Short timeframe
The Morning Star may indicate that an upward trend is possible, but it cannot tell you how long that trend will last.
News can disrupt viable trade setups
Companies can make surprise earnings announcements, report a bad debt, and release news that CEO is leaving. These and other events can make the Morningstar Pattern fail as fundamental traders take over. This is why you need to be wary about entering the trade when you see the first candle as a Morningstar forms. Wait until at least the third day.
News can be especially disruptive if you use this three-candle pattern to trade cryptocurrency.
Examples of famous traders who use the Morning Star Candlestick Pattern candlestick pattern
Charles Dow – is credited with formalizing and spreading technical trading. He helped create the Dow Jones Industrial Average, which is cited daily as an index for the market.
Jack Schwager – is considered a prominent modern user of technical analysis. HIs book Market Wizards provides guidance on using the patterns such as the Morning Star.
Sudarshan Sukhani – is the president of the Association of Technical Analysts and is considered an expert in technical analysis.
Robert Rhea – wrote the book The Dow Theory, which explains the foundations of technical trading.
William P. Hamilton – used technical analysis to predict the 1929 stock market crash.
John Magee – wrote Technical Analysis of Stock Trends. Though the above pioneers helped create technical analyses of the markets, Magee was the first person to make trades based only on stock prices and patterns. The Morning Star pattern figures prominently in his analysis.
How many types of Morning Star Candlestick Pattern candlestick patterns are there?
A Morning Star may have either a red or a green candlestick at the lowest point of the pattern.

Either a green or red candlestick at the bottom of the pattern can be a bullish indicator.
How to trade a Morning Star Candlestick Pattern candlestick pattern
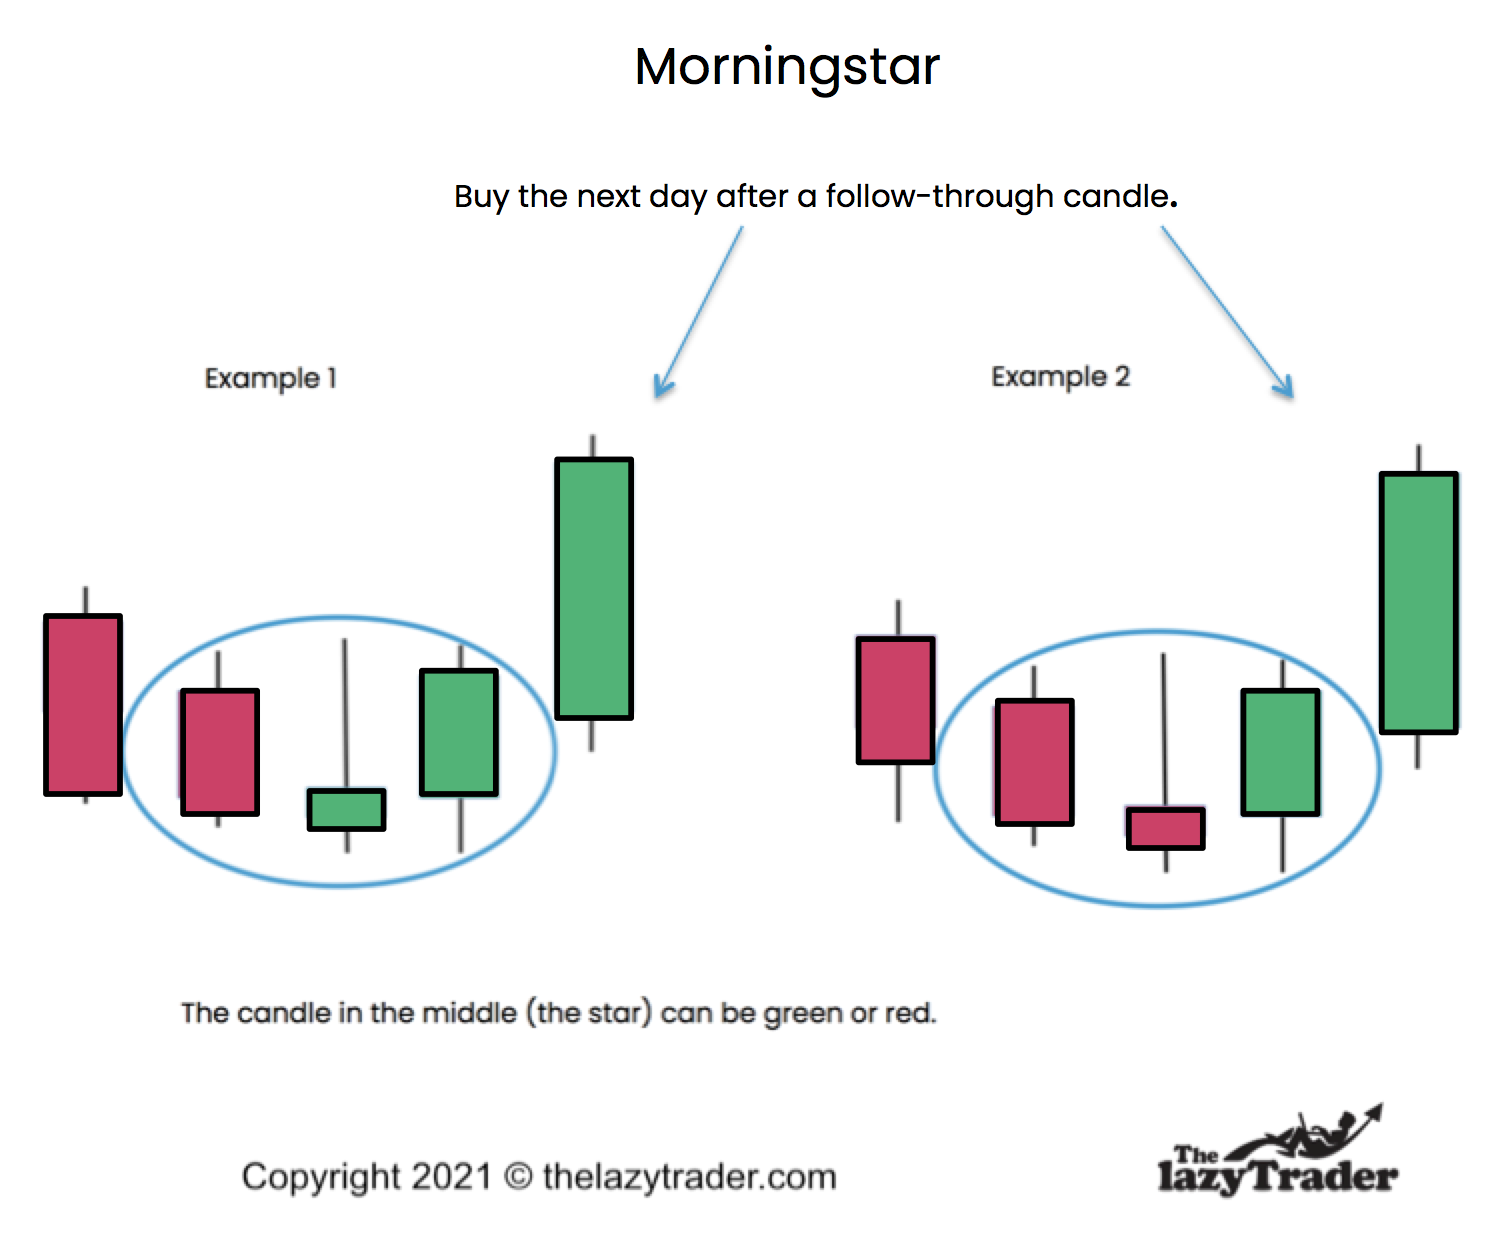
A full morning star requires two to three days of follow-through to complete. Your risk goes down with each day you wait. Wait until you see a bullish candle two or three days after the bottom. It is even more significant if that bullish candle has a gap up—that is, it opens higher than the previous day’s candle with on intervening trades. If you see a gap down, the pattern may be failing. It is bearish. This kind of volatility can be a warning sign.
A Morning Star Candlestick Pattern candlestick pattern trading strategy
You should have a strategy, and that strategy should be based on your risk tolerance. If your plan is to take on as little risk as possible, you will want to wait until the second follow-through day. If your strategy is to take high risks in anticipation of high rewards, you may want to get in on the first day, especially if there is a gap up.
But beware if you see a bearish candle after you get in. If it has a gap down below the body of the middle candle, it may be time to get out. This chart pattern is a sign of failure in the price trend. entry
When you see the Morning Star forming in the stock market, enter the trade the day after you are convinced the downtrend may have ended and a bullish reversal has begun. It is wise to wait until you see a second candle confirming the reversal. Make sure it closes higher than the previous candle and is not just a small candle. . A price trend lasts more than a couple of days, so watch to see if the trend goes up for at least a week if you want to be cautious.
A morning star trading strategy
Trade entry
When you see the Morning Star forming in the stock market, enter the trade the day after you are convinced the downtrend may have ended and a bullish reversal has begun. It is wise to wait until you see a second candle confirming the reversal. Make sure it closes higher than the previous candle and is not just a small candle. . A price trend lasts more than a couple of days, so watch to see if the trend goes up for at least a week if you want to be cautious.

Trade exit
You have a few ways to plan to exit the trade.
You can (and should) place a stop-loss order that will trigger a sale. Consider placing a stop-loss order at the stock’s low when it formed the Hammer. Setting it too close to the current price could cause it to sell during normal fluctuations in price. This is known as “getting stopped out.”
If you start to see profits building, consider a trailing stop-loss order. You select a percentage for this type of order. As your price moves up, the trailing stop-loss order moves up with it so that you always have the same percentage you are willing to lose.
If all goes well and you are making profits, your exit strategy can be to hold the stock until you see a reversal pattern, such as an Evening Star, that suggests it may come back down.
Trade management
In addition to setting your automatic stop-loss orders, you should be prepared to make changes to the trade. Some people sell partial shares to take profits as prices rise so that they lock in profits. This is especially important for beginners who may not recognize how volatility can eat up profits.
You may want to reinvest any dividends you receive. And you may want to sell early and move your funds to a more attractive opportunity. The point is that you must manage the trade as long as you own the asset. Make sure the uptrend does not get interrupted by a bearish candle.
Educate Yourself About the Basics
The Morning Star pattern is one of many tools technical traders use. You can learn more about it through sources that deal with technical trading. Learn how patterns work, including the Inverted Hammer, so you will understand the context for using that pattern.
You will need to learn about candlestick trading. This is a graphic representation of prices, as seen throughout the images in this guide. Here are some learning sources to get you started.
Note that trading patterns also work for forex.
Select a proven strategy with objective rules for entry and exit
Establish rules for entry and exit on trades and stick to those rules. You have some suggestions and guidelines in this guide, so make choices that make sense to you and don’t change every time you make a mistake.
What are the Morning Star Candlestick Pattern candlestick pattern trading platforms?
eToro
This platform allows traders to communicate on Twitter and Facebook. You can share trading ideas and experiences with other traders. One helpful feature is the ability to examine professionally managed stock portfolios.
Ava Trade
Ava offers platforms for multiple experience levels. You can automate your trades and follow expert traders to learn from their insights.
Naga Markets
This platform is not available in the U.S. Naga allows you to copy the best traders on the platform. You can trade stocks, cryptocurrencies, and Forex across the world.
FP Markets
FP uses the Autotrade tool. This allows traders to copy-trade, and it offers live statistics, along with risk-management systems. You can see the entire trading history of the most successful traders and mimic their methods.
Zulu Trade
The platform allows a low minimum deposit. Those trading for the first time can get started here. Free demo available. Trade forex, commodities, indices, stock, and cryptocurrencies.
5 Tips for Successful use of a Morning Star Candlestick Pattern candlestick pattern
- Make sure a downtrend precedes the Morning Star. The longer the trend, the better.
- Ease into the trade with small amounts to see if you are making a profit. If it is a reversal of the downtrend, there will be plenty of opportunities to get in.
- Once your trade is profitable, set your stop-loss level at a price that guarantees you get profit if a sale triggers.
- Don’t move your stop-loss order lower. Let it trigger a sale and live to fight another day.
- If the market is especially volatile, meaning there are big up and down swings on a daily basis, a Morning Star is more likely to fail. Let things calm down.
Morning Star Candlestick Pattern candlestick pattern: General terminology
Reversal – This term refers to a sudden change of the trend so that it heads in the opposite direction.
Support – Support is a level the price has consistently dropped to and then sprung upward again.
Gapping – This is a sudden surge in a price with no gradual rise. Instead, the asset will open higher with no intervening trades.
Volume – This is the number of shares exchanged each day. If you see an increase in volume on up-trades after a Morning Star, that suggests strength.
Stop-loss – Set a stop-loss order that executes automatically if the price drops to a specified level.
Dead cat bounce – It refers to a fake price recovery after an asset has dropped severely in price. The bounce does not sustain itself, and prices continue to drop.
Moving average – This is the average price direction over a specified period. Use a moving average to identify a downward trend.
Trend line – This is an imaginary line you can draw across the highs and lows (peaks and valleys) of prices.
Limit Order – This is a buy order that specifies the price at which you want the trade to execute.
Market Order – This is a buy order that allows the market to set your price. This can be dangerous because the price could pop higher at the moment your order is executed.
Getting Stopped Out – This happens when you set a stop-sell order too close to the current price.
Bullish vs. Bull Market – When you hear that a pattern is bullish, that means the price is likely to rise, but only for that asset. A bull market refers to an overall uptrend in all assets in an index.
Keep a trade journal of the trades you take
You must eliminate bias in your appraisal of your trading skills. Memory is not reliable. Write down your trades and keep track of your percentage of winners. Are you actually making money?
Conclusion
If you are going to use technical trading, you need to know the Morning Star pattern. It is a strong signal and is relatively easy to spot. Study it, practice with it. Also, look over past charts to see when it has formed and how prices responded.
Frequently Asked Questions (FAQs)
How reliable is the morning star pattern?
It is one of the more reliable. Most traders rate it at 70-80% reliability.
Is the morning star bullish or bearish?
This is a bullish pattern.
Why is called Morning Star?
It is not clear where the name came from. When candlesticks were invented, many of the names were warlike. This gentle one perhaps indicates a new day is coming?
Is there a particular risk with the morning star candlestick pattern?
Whenever you are trying to pick a bottom for prices, there is a risk that prices may continue the downward trend.


