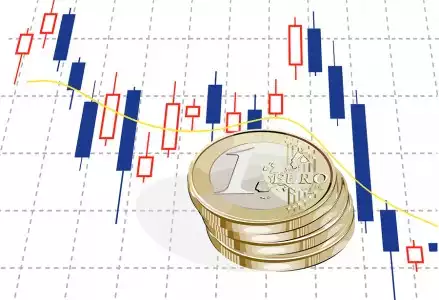
Despite Forex traders looking for every advantage possible, a volume indicator is often left as the last port of call. Many retail Forex traders first look at the graph. A currency which is going up is often seen as attractive, because it may continue to go up… but how can you check that this trend will continue? A car with a stated large engine is attractive, but why not check under the bonnet?
The firm's main research and development office is based in Tel Aviv Israel. It originally specialized in Forex and indices spreadbetting and CFDs but has recently expanded in stock trading also.
At the time of writing, eToro has 2.2 out of 5 star on Trust pilot. The comments suggest that the platform offers some impressive features but withdrawing money can be difficult. Having said that, some of the negative reviews appear to be rants rather than constructive criticism. This can be examples of traders losing money through their own recklessness rather than eToro's fault. You should therefore take this reviews with a pinch of salt.
“the platform offers some impressive features but withdrawing money can be difficult.”
76% of retail investor accounts lose money when trading CFDs with this provider.
OANDA is a global financial services company providing advanced currency solutions to both retail and corporate clients all over the world. In this article, we are going to review this broker’s trading options, tools, platforms, spreads, commissions, security measures, and educational resources to help traders make the right choice.
76.6% of retail investor accounts lose money when trading CFDs with this provider. You should consider whether you understand how CFDs work and whether you can afford to take the high risk of losing
AvaTrade offers a wide variety of trading solutions (spread trading, CFDs, and social trading), and peace of mind with its comprehensive regulation, covering the EU, Australia, Canada and South Africa. Clients can use a variety of platforms for discretionary and automated trading.
76% of retail investor accounts lose money when trading CFDs with this provider.
Offers multiple asset classes, platforms, and regulated in a variety of regions. Caters for a global audience. Awarded with the Highest Overall Customer Satisfaction Award for 5 years running - Investment Trends CFD Report 2015.
A standalone copy-trading ecosystem, providing equities, foreign exchange, commodities and cryptocurrencies markets. Provides a global selection of brokerages.
Pepperstone is a global regulated broker that provides its clients with the latest technologies for trading multiple assets such as Forex, indices, cryptocurrencies, stocks, ETFs, and commodities. This article provides an overview of its trading platforms, tools, fees, protection measures, and other aspects to help traders make a more informed decision.
Feel the (driving) force
In simple terms, a volume indicator is measure which will highlight how many securities were traded during a given period of time. Any technical trader looks at the graph, but how often do they look at what propels the graph? For the graph to keep going up or down then someone must be driving it. This means buyers or sellers. If you can work out how many more buyers than sellers there are (or vice-versa), then there is a fair chance you will have a good idea which way the graph is going.
Do not let your eyes deceive you…
Volume indicators can work both ways. Although we have spoken about using it to predict which way the graph is going next, it can also be used to explain unnatural moves. If you wake up to find a large move in a stock in a quiet period of the year (e.g. August or December) it would be a good idea to check the volume. If there are low volumes, then a sudden rash of orders, not necessarily big ones, can cause a large move, which will be more powerful than the demand suggests. The resultant spike in the share may suggest a large move, but this has been artificially created by low volumes. Something to be aware of before you jump into trading this trend!
How many volatility indicators are there?
Simply put, there are many. We have listed a few below which you can use to your advantage when volatility trading.
Average volume: Fairly simple in that it is the number of securities that have been traded over a period of time. The devil is in the detail though:check what the time period is! It can be all sorts such as minutes or hours.
Volume momentum: as the name suggests it measures the growing force of buyers. In effect it is a multiplier factor, where you are looking for a growing number of buyers (or sellers!) at each data point. Ideally you want to spot this early so you can 'ride the wave' and eventually get out before the momentum changes direction.
Force index indicator: a more complex volume indicator, the force index requires a bit of mathematics. It assigns a number to the power required to move a security. It can be particularly useful to spot when a security is going to break out, before volume momentum takes hold.
Volume oscillator: An interesting measure as it plots the relationship between two moving averages. This allows you to gauge which is the strongest between the two and which may help you place a Forex trade.
Balance volume: Another measure which helps to predict a breakout, it works by showing the relationship, or lack of, between volume and movement in the price of a security. If there is a sudden increase in volume but no noticeable move in the price of the security, then the likelihood is that a sudden and strong directional move will occur. Balance volume helps identify this.
Conclusion
There are other indicators, indeed one of the most famous, the Relative Strength Index (RSI)is worth being aware of. It can be applied to trading many different securities but also Forex trading. All indicators are useful, but a word of warning! Rubbish in - rubbish out... Although commonly used to describe that data being input into a model may be rubbish, giving you rubbish results, it can also be applied to indicators. You can use them to confirm trade ideas, but not necessarily rely on! Keep your wits about you when trading currency volatility by sticking to a disciplined approach and your trading plan!


 In simple terms, a volume indicator is measure which will highlight how many securities were traded during a given period of time. Any technical trader looks at the graph, but how often do they look at what propels the graph? For the graph to keep going up or down then someone must be driving it. This means buyers or sellers. If you can work out how many more buyers than sellers there are (or vice-versa), then there is a fair chance you will have a good idea which way the graph is going.
 Volume indicators can work both ways. Although we have spoken about using it to predict which way the graph is going next, it can also be used to explain unnatural moves. If you wake up to find a large move in a stock in a quiet period of the year (e.g. August or December) it would be a good idea to check the volume. If there are low volumes, then a sudden rash of orders, not necessarily big ones, can cause a large move, which will be more powerful than the demand suggests. The resultant spike in the share may suggest a large move, but this has been artificially created by low volumes. Something to be aware of before you jump into trading this trend!
 There are other indicators, indeed one of the most famous, the