Yen trades could prove an intriguing prospect due to the US presidential election. The Dow and gold setups discussed in previous posts have not triggered their respective Blue Boxes as of this weekend. It is worth emphasising that the setups are valid even if they trigger after election night. The actual results of the election may be delayed for several days, with mail-in ballots being counted. Furthermore, the technical setup is valid regardless.
The firm's main research and development office is based in Tel Aviv Israel. It originally specialized in Forex and indices spreadbetting and CFDs but has recently expanded in stock trading also.
At the time of writing, eToro has 2.2 out of 5 star on Trust pilot. The comments suggest that the platform offers some impressive features but withdrawing money can be difficult. Having said that, some of the negative reviews appear to be rants rather than constructive criticism. This can be examples of traders losing money through their own recklessness rather than eToro's fault. You should therefore take this reviews with a pinch of salt.
“the platform offers some impressive features but withdrawing money can be difficult.”
76% of retail investor accounts lose money when trading CFDs with this provider.
OANDA is a global financial services company providing advanced currency solutions to both retail and corporate clients all over the world. In this article, we are going to review this broker’s trading options, tools, platforms, spreads, commissions, security measures, and educational resources to help traders make the right choice.
76.6% of retail investor accounts lose money when trading CFDs with this provider. You should consider whether you understand how CFDs work and whether you can afford to take the high risk of losing
AvaTrade offers a wide variety of trading solutions (spread trading, CFDs, and social trading), and peace of mind with its comprehensive regulation, covering the EU, Australia, Canada and South Africa. Clients can use a variety of platforms for discretionary and automated trading.
76% of retail investor accounts lose money when trading CFDs with this provider.
Offers multiple asset classes, platforms, and regulated in a variety of regions. Caters for a global audience. Awarded with the Highest Overall Customer Satisfaction Award for 5 years running - Investment Trends CFD Report 2015.
A standalone copy-trading ecosystem, providing equities, foreign exchange, commodities and cryptocurrencies markets. Provides a global selection of brokerages.
Pepperstone is a global regulated broker that provides its clients with the latest technologies for trading multiple assets such as Forex, indices, cryptocurrencies, stocks, ETFs, and commodities. This article provides an overview of its trading platforms, tools, fees, protection measures, and other aspects to help traders make a more informed decision.
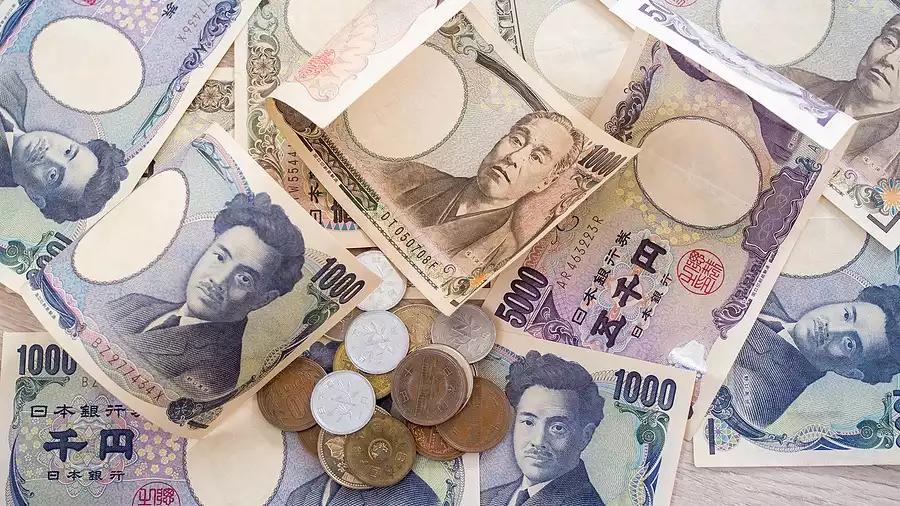
Yen trades in a risk off environment
For trades that are more likely to trigger prior to the election, we turn to the lower timeframes. With most currencies in consolidation on the higher timeframes, high probability trades are few.
The best setups seem to be occurring in with Yen currency trading pairs, and even then only on one or two of the pairs. USDJPY is the logical pair to be looking at, as the USD is a safe haven. Yen also tends to do well in risk-off environments as well. We will therefore focus on Yen trades.
With uncertainty overall rising, it seems likely that this will spark a trend in one or the other (or both) of the risk-off currencies. In each situation, the trading community will tend to prefer one more than the other, but with no apparent hard and fast rule. Thus, technicals come into play.
The USDJPY daily chart (Figure 1) shows a downtrend developing after a choppy consolidation period. The current move down could develop in several ways. One would be to rise to test the high of the channel, as shown by the upward-pointing arrow in Figure 1.
Process the various scenarios
However, a manual read of the swing shows that it is still moving down at relatively high speed. Although not an exceptionally great momentum trade, it is sufficient to be valid. Pattern trading-wise, curvature of the bottom currently formed appears to be too sharp to signal a bottom, although that is a value judgement and could easily be proven wrong.
Perhaps the most value argument for a potential short here is not in terms of probability, but in terms of potential reward. The current low shows a level that has been tested thrice since July 2020. It is significant that with each bounce, lower highs were formed. Using descending triangle type logic, this suggests that a break of this level will result in a significant move.
Do not forget the four hour chart
The four-hourly chart shows promising developments, with a recent 5-wave Elliot move recently having been completed. Strict Elliott wave traders will note that wave 4 went slightly above the low of wave 1, but for the style practiced here, it has been noted that the penetration is extremely slight, and it is a wick-penetrating-wick situation.
Thus, this is an acceptable setup. If the reading is correct, one might expect an a-b-c retracement to a higher zone of resistance, given here as 104.88-105.16, corresponding with previous levels of support and resistance. Thus, we shall be looking for a valid potential entry short from this zone on the hourly chart.
Technical analysis extraordinaire
Figure 3 shows the hourly chart of USDJPY. The a and b waves are marked. In line with typical Elliott theory, the c wave can be further decomposed into five smaller waves: i-ii-iii-iv-v. We shall theoretically assume that wave ii has been formed.
Wave iii needs to be relatively larger, and as a rule of thumb, we shall assume that it will only be formed once the Blue Box has been activated. Thus, once the Blue Box is touched, we would note any hourly candlestick reversal patterns (bearish engulfing, bearish harami and pin bars are most common).
Once these reversals trigger, usually by going below the low of the relevant setup candlesticks (i.e. the first candlestick of of the engulfing and the harami, as well as the low of the pin bar), we will consider wave iii to have formed and wave iv to be in progress.
If you fail try try again
We would then want another high to form a wave v. With the second set of reversal candlestick patterns to the downside (same as above), we would go short. The hope is to ride the beginning of a large potential wave.
Given market choppiness, we might be stopped out with the stop just above the candlestick trigger. However, we would be willing to try a second time if the opportunity arose. Attempts are limited to two per Blue Box.
All scenarios have been covered
If this triggers, it could provide a nice trend to the downside, with limited risk. Of course, there is a possibility that the market could continue down without even activating the Blue Box or after the first reversal. In this case this trade would likely miss the election trend.
There is little that can be done about that, but solace can be drawn from the fact that in that scenario, one of the other setups is likely to be triggered. I wish you all the best with your election trading and with your yen trades.
Further content from Kaye Lee can also be found on his website: Straight Talk Trading.


 Takeaways