How can I trade Fibonacci and Fibonacci Retracements confidently? The Fibonacci tool is very popular among traders and is can be used in the technical analysis of all asset classes and for all timeframes. If used correctly, it can be very powerful in helping the trader to successfully analyse the market in addition to determining potential buy or sell levels.
The firm's main research and development office is based in Tel Aviv Israel. It originally specialized in Forex and indices spreadbetting and CFDs but has recently expanded in stock trading also.
At the time of writing, eToro has 2.2 out of 5 star on Trust pilot. The comments suggest that the platform offers some impressive features but withdrawing money can be difficult. Having said that, some of the negative reviews appear to be rants rather than constructive criticism. This can be examples of traders losing money through their own recklessness rather than eToro's fault. You should therefore take this reviews with a pinch of salt.
“the platform offers some impressive features but withdrawing money can be difficult.”
76% of retail investor accounts lose money when trading CFDs with this provider.
OANDA is a global financial services company providing advanced currency solutions to both retail and corporate clients all over the world. In this article, we are going to review this broker’s trading options, tools, platforms, spreads, commissions, security measures, and educational resources to help traders make the right choice.
76.6% of retail investor accounts lose money when trading CFDs with this provider. You should consider whether you understand how CFDs work and whether you can afford to take the high risk of losing
AvaTrade offers a wide variety of trading solutions (spread trading, CFDs, and social trading), and peace of mind with its comprehensive regulation, covering the EU, Australia, Canada and South Africa. Clients can use a variety of platforms for discretionary and automated trading.
76% of retail investor accounts lose money when trading CFDs with this provider.
Offers multiple asset classes, platforms, and regulated in a variety of regions. Caters for a global audience. Awarded with the Highest Overall Customer Satisfaction Award for 5 years running - Investment Trends CFD Report 2015.
A standalone copy-trading ecosystem, providing equities, foreign exchange, commodities and cryptocurrencies markets. Provides a global selection of brokerages.
Pepperstone is a global regulated broker that provides its clients with the latest technologies for trading multiple assets such as Forex, indices, cryptocurrencies, stocks, ETFs, and commodities. This article provides an overview of its trading platforms, tools, fees, protection measures, and other aspects to help traders make a more informed decision.
Some successful traders swear by it as their "go to" technical tool; using it both as an indicator for market analysis as well as to select their entries and exits. Conversely, many professional traders simply use the Fibonacci Indicator in conjunction with other proven tools for technical analysis, such as candlestick patterns.
Whichever camp you end up joining, it makes sense to start with the Fibonacci basics.
Whether it's Fibonacci retracements, Fibonacci extensions, Fibonacci time zones, Fibonacci levels,the number of variants can often be bewildering for the trader.
In this article, we will explain what Fibonacci is, its origins, how you can successfully draw Fibonacci retracements so that you can identify potential buy levels in up-trends and sell levels in down trends.
Unfortunately, Fibonacci as a universal concept is often misunderstood and overcomplicated which, in turn, has a detrimental impact on the trader's ability to clearly read markets. So, a clear understanding into Fibonacci as a universal concept as well as the ability to correctly read them is essential in order to survive in forex and, of course, long-term trading success.
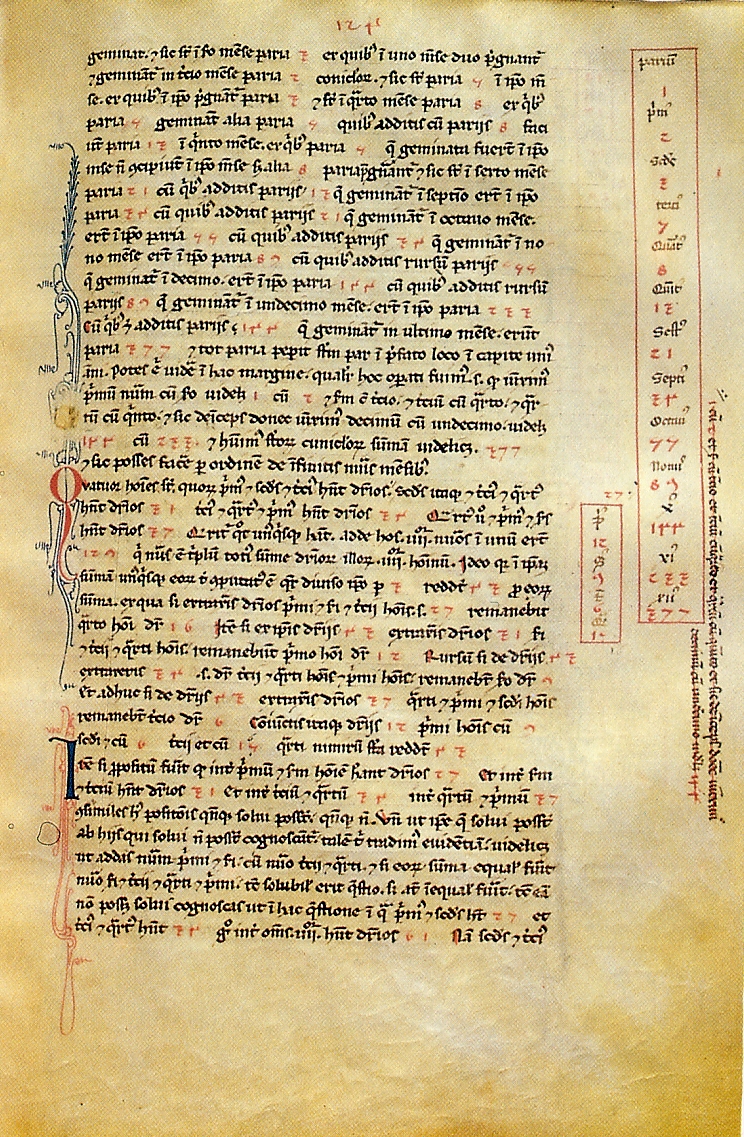
What is Fibonacci - The Origin
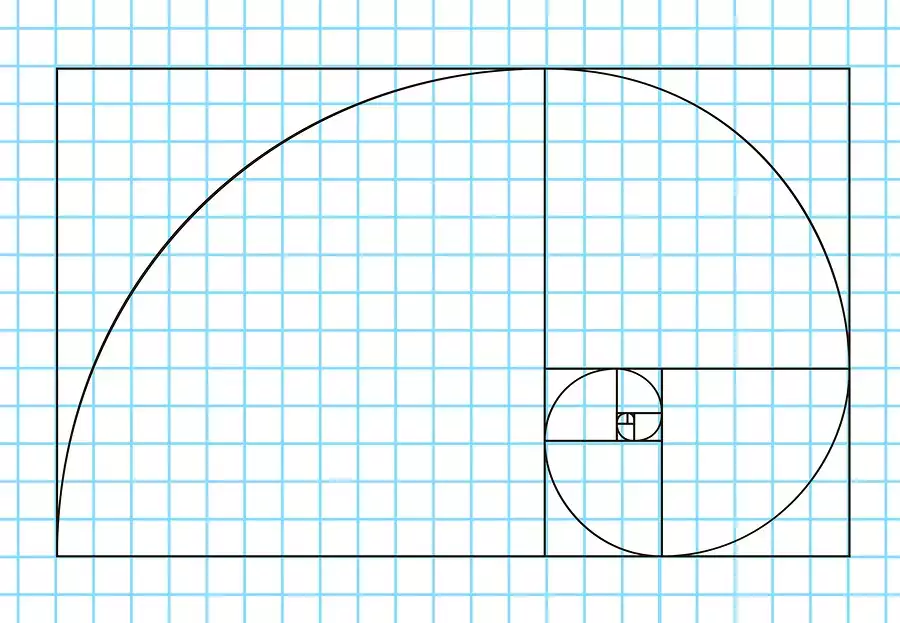
Fibonacci sequence, also known as "The Golden Ratio," can be seen in many aspects of life and has been present since the dawn of mankind; from the proportioning of the human body, the formation of waves, to the creation of flowers. In fact, it's safe to say that Fibonacci numbers govern the very rules that determine how the planet and the human race were created. We just did not know about it….until Leonardo di Pisa's discovery (aptly known as Fibonacci), who thrust Fibonacci sequence into the limelight after his publication of Liber Abacci (published in 1202). Fibonacci originally used Fibonacci Sequence to forecast the projected growth of a rabbit population after twelve months in an enclosed space.
Fibonacci sequence:
0, 1, 1, 2, 3, 5, 8, 13, 21, 34
Fibonacci sequence numbers are characterized by the fact that any one number in the sequence is the sum of the two preceding numbers.
For example:
1 + 1 = 2
1 + 2 = 3
2 + 3 = 5
3 + 5 = 8
5 + 8 = 13
8 + 13 = 21
How to Draw a Fibonacci Retracements
In Up-trending markets
As with many other aspects in life, we can also this phenomenon to successfully analyse financial markets, especially when we are trend following. That is, providing we do it correctly. Here's what we need to do:
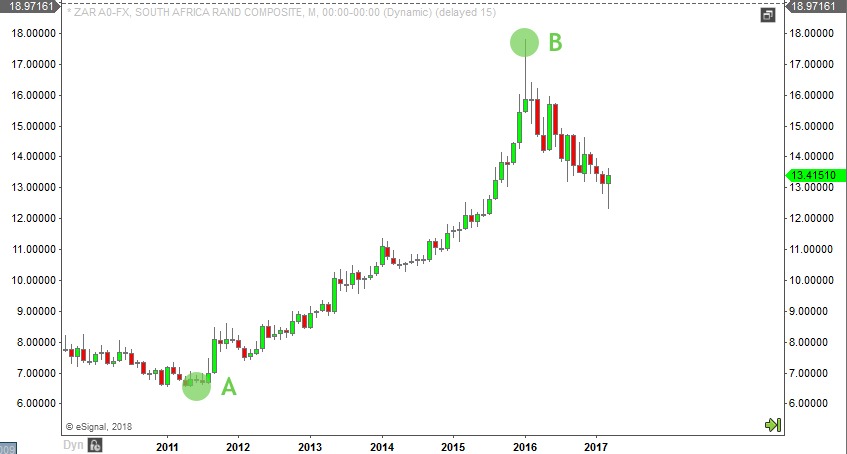
Example 1: Drawing Fibonacci retracements on the USDZAR weekly chart
Step 1: Find The AB Move
In order to correctly find a Fibonacci retracement level, our first step is to identify the most recent (obvious) Swing Low and Swing High. The chart(s) in our first example below refers to the US Dollar V the South African Rand (USDZAR).
As you will see, Point A represents the very start of the US Dollar's bull run against the South African Rand, starting in mid-2011. This point is therefore known as the "Swing Low". Point B, in contrast, will represent the "Swing High" - as it represents the highest price the US Dollar reached against the South African Rand in late 2015, before its pullback. Both points are extremes in price and will make a very good starting point for our "market template" using Fibonacci retracements.
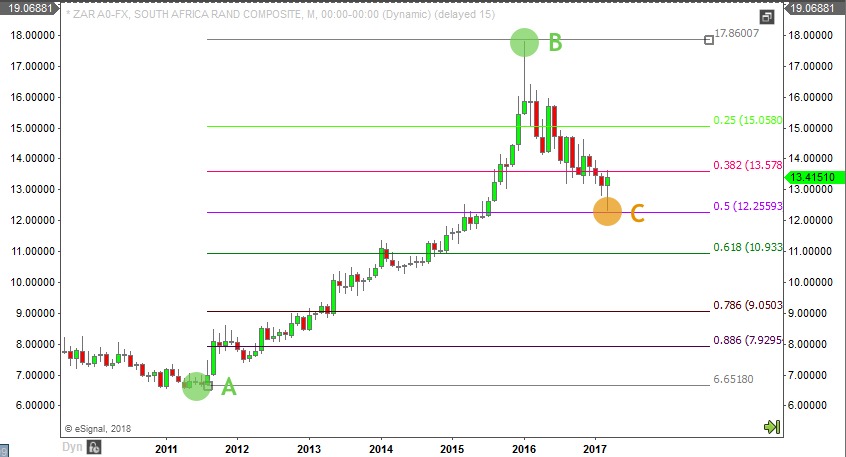
STEP 2: Connect Points AB To Find "Point C" - The Retracement Level
Drag the Fibonacci retracement tool from the Swing Low to the Swing High (Point A to Point B). Using our Fib retracement tool, if we first click on the Swing Low (A) and then the Swing High (B), and this will automatically plot our fib lines on the chart.
Thanks to the application of our Fibonacci retracement levels, we can see that the US Dollar has retraced to the 50% fib level and has rejected it. Will the US Dollar continue in its upward move? Time will tell. However, up to Point C, we can certainly determine the market has found support at this Fibonacci level, at a 50% Fibonacci retracement, before buyers have come back into the market.
Step 3: Using The Market Map of Fibonacci Retracements
As we now have the fib levels plotted on our chart, we now have a very effective market template which reveals Fibonacci-based support levels which could interact with price prevent price falling further.
The Fib levels we use are: 0.382, 0.5, 0.618 and the 0.786.We have found these specific levels to be the most effective in our trading as the can represent turning points.
This will allow us to see what Fibonacci number could be or has already been respect after the market retraces or "pulls back". The Fib level which holds as support (preventing price action from continuing further down), is known as Point C. It is at this point where the market pauses and continues in an upward direction with the prevailing trend.
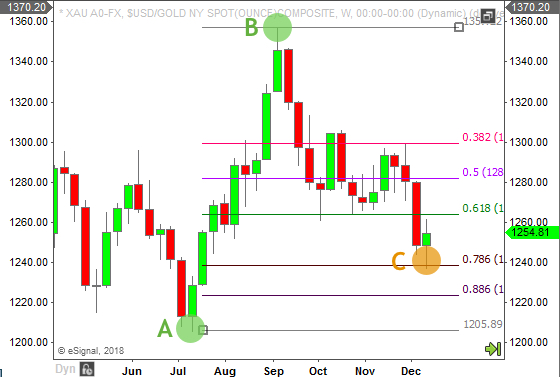
Example 2: Drawing Fibonacci retracements on Gold's weekly chart
Step 1: Find The AB Move
In order to correctly find a Fibonacci retracement level in an up-trend, we need to identify the recent obvious swing low to swing high. On the Gold chart below, we can see that Point A represents the lowest point before the up-ward move (the Swing Low), whereas Point Brepresents the highest point in that move (the Swing High).
STEP 2: Connect Points AB To Find "Point C" - The Retracement Level
Drag the Fibonacci retracement tool from the Swing Low to the Swing High(Point A to Point B). As before, using our Fib Retracement tool, if we first click on the Swing Low (A) and then the Swing High (B).
Thanks to the Fibonacci retracement levels, we can see that Gold has retraced to the 786 Fibonacci retracement level and has rejected it. Will the Gold continue its march upwards? Time will only tell tell. However, up to this point, we can certainly determine the market has found support at a valid Fibonacci-based support level.
Step 3: Using The Market Map of Fibonacci Retracements
We now have our Fibonacci retracements on the chart; 0.386, 0.5, 0.618 and the 0.786. This will enable us to view our Fibonacci retracement (levels of support) which could interact with price.
The Fib level which holds as support (preventing price from continuing further down), is known as point C. It is at this point where the market pauses and continues in an upward direction with the prevailing trend.
As we can see, Gold retraced back to the 0.786 level (representing Point C) and rejected it. This gives us an excellent market signal that we could see the gold market continue to the upside.
How to Trade Fibonacci and Fibonacci Retracements
In Down-trending markets
If the market is trending downwards,we do exactly the same, except the inverse. Simply click and drag the Fibonacci retracement tool from the most obvious Swing High to the Swing Low (Point A to Point B).
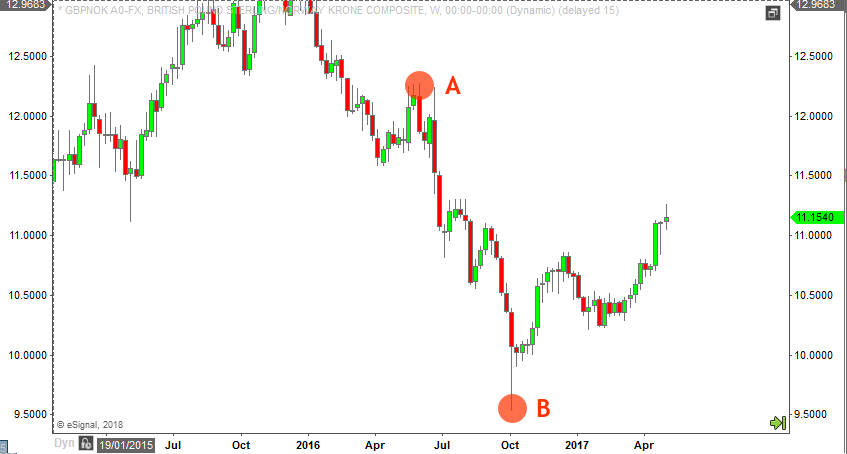
Example 1: Drawing Fibonacci retracements on GBPNOK
Step 1: Find The AB Move
In order to correctly find a Fibonacci retracement level, our first step is to identify the most recent (obvious) Swing High and Swing Low respectively. It may be the very start of the down move, or meaningful retracement before the lowest point in the cycle. The chart(s) in our first example below refers to the the British Pound Vs the Norwegian Krone (GBPNOK).
As denoted on the chart above, our Point A occurs after a pullback, at a significant Swing High. Please note that we can apply the Fibonacci retracement from multiple swing highs to the very low of the cycle; it does not necessarily have to be from the very start of the move(however, past experience dictates that this is generally the best point on which to have your Point A).
Point B reflects the very lowest price the British Pound fell against the Norwegian Krone (in this cycle) before it pulled-back and retraced in value.
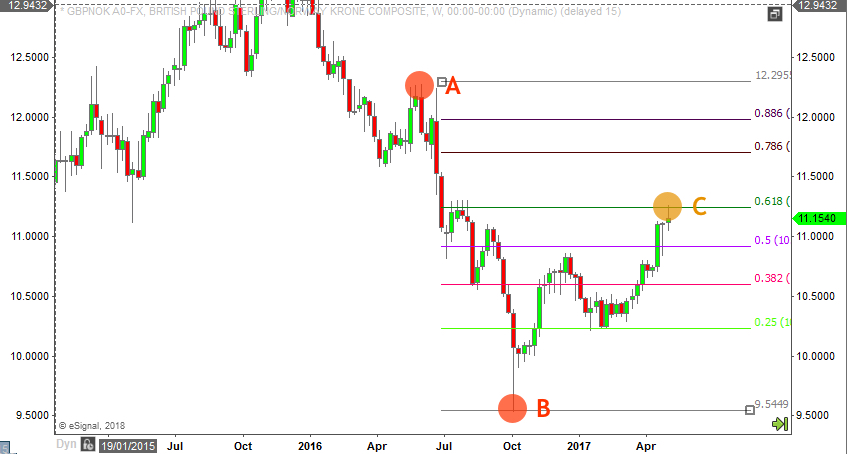
STEP 2: Connect Points AB To Find "Point C" - The Retracement Level
Drag the Fibonacci retracement tool from the Swing Low to the Swing High (Point A to Point B). As before, using our Fib Retracement tool, if we first click on the Swing Low (A) and then the Swing High (B), our Fibonacci retracements should appear.
Step 3: Using The Market Map of Fibonacci Retracements
We will then have our Fibonacci levels plotted onto the chart. As we are applying the Fibonacci retracement tool to a down-trending market, we are now able to identify Fibonacci-based levels of resistance. As with up-trending markets, the Fib levels we use are: 0.386, 0.5, 0.618 and the 0.786. This will enable us to view our Fibonacci retracement (levels of resistance) which could interact with price, preventing it from going up further in the retracement or "pullback".
The Fib level which holds as resitance (preventing price from continuing further upwards), is known as Point C. It is at this point where the market pauses and continues in its downward direction with the prevailing trend.
As we can see, GBNOK retraced back to the 0.618 retracement level (representing Point C) and rejected it. At the time, this gave us an excellent market signal that we could then see the GBPNOK potentially continue to the downside.
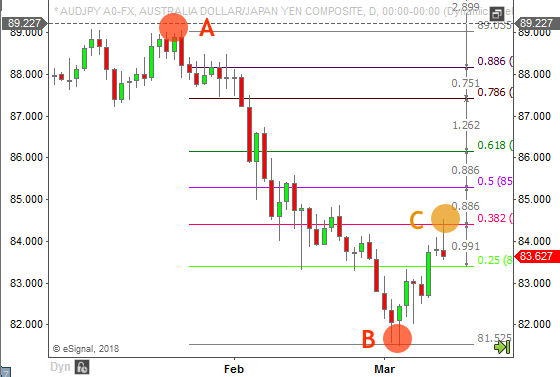
Example 2: Drawing Fibonacci retracements on AUDJPY weekly chart
As with the previous example, our first step in drawing our Fibonacci retracement levels is to identify the most recent obvious and, therefore, the most significant Swing High and Swing Lows. It may be the very start of the down move, or meaningful retracement in the cycle before the low is reached.
Step 1: Find The AB Move
The above chart refers to AUDJPY on the weekly chart. Our Point A is at the very start of the move down, while Point B represents the lowest point of the trend. We now have avery clear idea of the parameters we can now work within!
STEP 2: Connect Points AB To Find "Point C" - The Retracement Level
Drag the Fibonacci retracement tool from the Swing High to the Swing Low (Point A to Point B). As before, using our Fibonacci Retracement tool, if we first click on the Swing Low (A) and then the Swing High (B), and this will reveal our Fibonacci retracement levels and give us our Fibonacci-based market template.
Step 3: Using The Market Map of Fibonacci Retracements
Now our Fibonacci retracement levels are plotted onto the chart, we can identify Fibonacci-based levels of resistance which could obstruct the Australian Dollar from increasing in value against the Japanese Yen.
As we can see, our Point C reveals that the point of rejection by the market was the 0.382 Fibonacci Retracement level.
This gives us an excellent indicator that we could see the AUDJPY potentially continue to the downside, after finding a "ceiling" a the 382 level after its failure to extend beyond it.
Tips: How to trade using Fibonacci Retracements
1. If in doubt - move on and stay out!
Remember, don't force the Fibonacci! When the Point A and Point B are not obvious, it's likely that the Fibonacci Retracement will be applied incorrectly and this will have a detrimental impact on your ability to analyse the market. There are thousands of tradable instruments available there is absolutely no point in trying to force an outcome on a chart which is giving you nothing! just move on to a chart where the Swing Highs and Swing Lows (Points A and B) are singing to you
2. The higher the timeframe, the stronger the Fibonacci retracements
Whether it's the 0.786, 0.618, 05, or 0.382, Fibonacci retracements and retracement levels increase in their significance on the higher timeframes. Suffice to say Fibonacci-based levels of support and resistance are strongest on the weekly and daily timeframes (end of day trading) compared to the intra-day equivalents. , This is very much the case with other forms of technical analysis such as horizontal levels and trend-lines.
3. Don't rely on Fibonacci exclusively
While there is little doubt that Fibonacci is an excellent addition to your trading toolkit, it is most effective when used in conjunction with other forms of technical analysis. As technical traders, we look for recurring technical nuances and clues. If we have confluence of a Fibonacci retracement level after a pullback with a previously tested moving average, horitzonal level or trend line, this will add weight to our technical argument.
Conclusion
Fibonacci may be a fundamental staple to everyday life, but it should also be to your trading toolkit too.
Once you understand the how Fibonacci retracements work, you can apply this logic to any instrument, asset class and on any timeframe. Whether you are a range trader or a trend follower, it can be applied to both markets.
Fibonacci retracements drawn correctly give us an effectivemarket snapshot, revealing Fibonacci-based levels of support and resistance, and potential key turning points. As with any form of technical analysis, it should not be used exclusively but, rather, in conjunction with other technical tools.
We thoroughly recommend that you develop a rigorous understanding of Fibonacci in order to ensure your long-term trading success.