How Do You Use Technical Analysis in Your Trading?
August 16, 2017 Updated October 17, 2023
Technical analysis provides the very foundation for pure price-action trading. It may sound surprising when I readily admit that technical analysis has its limitations. Technical analysis is in no way a "perfect" science. Sound analysis alone cannot guarantee our success in the markets.
Despite its limitations, technical analysis is a cornerstone of our trading. We do not dream of investing or trading the markets without it. What follows, are a few ways to leverage the power of technical analysis as a foundational component of your larger trading strategy.
 Takeaways
What is technical analysis
How using it increases your success
Find out the steps to lower your risk but enjoy greater profitability!
Technical Analysis Reflects Market Psychology
 People have used chart-based representations of price and volume action across financial and other markets since as far back as the 17th and 18th centuries. The key distinction is, technical analysis has aimed to provide insight regarding the psychological and other forces that drive these markets. It does not predict any given market's next move(s). For example, the pin bar reversal is a primary chart pattern used to signal potential, high-probability trading opportunities. But we do not take new trade ideas simply because of the pin bar reversal itself. The pin bar signals an underlying market psychology.
This is exemplified by the decisive rejection when the price has tested a given level. Subsequently, it headed back very close to the opening price from that day or time period. From there, price is decidedly more likely to reverse due to the psychology that created the last bar. And essentially, the high-probability reaction is what we are trading the pin bar, not the chart pattern itself.
There are 3 main assumptions in technical analysis
- The market discounts everything: All factors, from fundamental forces, to news and economic data, are already "priced in".
- Price moves in trends: Includes short, medium, and long-term trends which can exist independent of one another.
- History is often repeated: Price is more likely to act in a manner consistent with past performance. It does not act erratically.
Identifies (Approximate) Levels of Key Support & Resistance
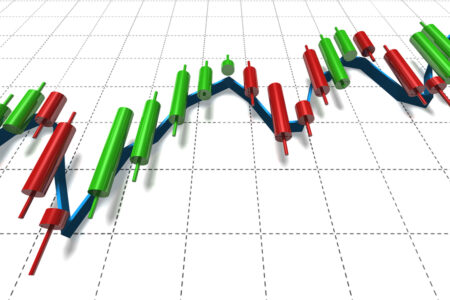 The price of many listed securities display a repetitive behaviour. As a result, key areas of support and resistance to which price is repeatedly drawn tend to appear on the chart of any asset. Using technical analysis principles, traders may draw trend lines, or use Fibonacci retracements. You can see all-time highs or lows, moving averages, or a host of other indicators to isolate such levels for the purpose of trading (such as Candlestick patterns). These levels, though, are only approximate. Key technical levels are not exact, which can plague and frustrate any trader. For example, what if price approaches, but does not formally touch the precise support or resistance level? Do you still have grounds for a trade?
This is yet another area where technical analysis is useful for traders. Yet it does not do all the work for us. Trading at or near key technical levels requires judgment and patience. Most of all, well-defined trading rules that you will follow each time.
An example would be a pin bar reversal occuring at or near a key support or resistance level. This means if it comes up a bit short of a formal test, or the wick pierces the level. As a rule, we will take that trade. This is especially true since we are trading most often on longer time frames.
We have the luxury of seeing the day's closing price and then placing the trade end of day. This ensures we will not be taken out by a possible intraday continuation. See why incorporating technical analysis within the parameters of your trading methodology is important?
Creates a Framework for Structuring Trades
 Technical analysis principles may also be used to set up, execute, and manage your trades. It can also help with analysing the markets and isolating potential trading opportunities. Traders protect their entries and stop losses through key psychological and technical levels. This also helps determine when (and where) to adjust risk, particularly when practising active, or "combative" trade management.
Easy Technical Analysis steps for you to follow
Below we have listed the various techniques to optimize the use of technical analysis.
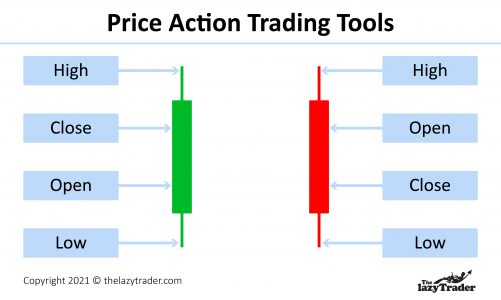
- Entry point: Our pin bar reversal trading strategy has specific rules, It requires price to break above the high (for long trades) or below the low (for short trades) of the previous bar. This triggers a formal entry. We use charts and key technical markers to confirm this. This ensures we do not enter in the trade until the continuation of the prior day's move occurs. We get a level of confirmation, and it promotes more confident trading.
- Stop loss placement: A hard stop loss may be placed at the pin bar's high (for short trades) or it's low (for long trades). This allows for enough room for a trade to move in our favour. It also uses technical analysis to determine a logical stop-loss price. The initial idea would be invalidated if the price is breached.
- Initial and longer-term price targets: The repetitive nature of the markets, and use of technical analysis can help traders. They will often opt to establish initial price targets for their trades at recent swing highs or lows. An example would be at Fibonacci retracement points. The trader may choose to book profits by selling a portion of their position at this juncture. Longer-term price targets may be established using medium- or longer-term swing highs and lows. This includes the all-time high or low for the asset being traded.
- Trailing stop location(s): We recommend that active traders use the following. Trail a stop above the high of every second seller bar (for short trades), or below the low of every second buyer bar (for long trades).
Conclusion
Technical analysis is a useful part of any investing or trading strategy. You learn to use the charts to buy at the optimum time. This ensure you pay less for your investments. In turn this means you compound your wealth to a greater extend!


 Takeaways





 The price of many listed securities display a repetitive behaviour. As a result, key areas of support and resistance to which price is repeatedly drawn tend to appear on the chart of any asset. Using technical analysis principles, traders may draw trend lines, or use Fibonacci retracements. You can see
  Technical analysis principles may also be used to set up, execute, and manage your trades. It can also help with analysing the markets and isolating potential trading opportunities. Traders protect their entries and stop losses through key psychological and technical levels. This also helps determine when (and where) to adjust risk, particularly when practising active, or

