October 10, 2022 Updated October 22, 2023

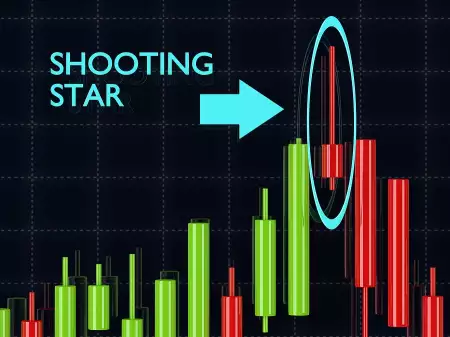
The Shooting Star suggests the uptrend may be over, and a downtrend may be beginning
One of the best ways to trade is to find tops and bottoms in a price chart. If you look for reversal patterns, you can anticipate when prices will go in a new direction. With the Shooting Star candlestick, you can see when to get out of a position so you won’t lose money. This is a reasonably reliable pattern that says watch out for a downtrend.
Learn to spot this pattern so you can take your profits. Learn not only to recognize the pattern but how to find the best selling place.
This is a reversal pattern. Watch for it during an uptrend, especially one that has sustained itself for weeks or months. . This happens when there are more sellers than buyers, traders want out of the position but have to lower the price so they can attract buyers.

This is a reliable pattern compared to other candlestick patterns. Of course, no pattern works all the time. It is simply a way to read the psychology of the market. What are traders thinking based on how the price action is behaving?
Be aware that looking for chart patterns is “technical trading,” as opposed to fundamental trading. Let’s look at the two approaches.
Traders may use both approaches but tend to lean more toward one.
Using the Shooting Star as a technical trading tool can help you, but you need to be aware of what it cannot do.
The excitement of trading can cloud your mind with emotion. You may be rooting for the price to go up, or you may become fearful it will drop. You make bad decisions when you trade emotionally. The Shooting Star shows you exactly what IS happening, so you will stop looking for what you wish would happen.
Shooting Stars have proven themselves. This pattern doesn’t guarantee a reversal, but if you see a Shooting Star, it is definitely time to pay attention. The Shooting Star has been used for a long time. It dates to the 18th century when Munehisa Homma, a rice trader in Japan, used this and other patterns to predict price directions.
You can easily find charts that feature candlesticks and clearly show Shooting Stars. They are easy to interpret.
Visualizing the price action lets you understand it. If you just look at a string of prices, you won’t get the big picture.
You can see how buyers and sellers lose and gain enthusiasm.
The Shooting Star is relatively reliable, but not 100%. It is a suggestion, not a firm guide.
The Shooting Star forms in a day. If you don’t see it, you mail be left taking losses.
Many traders make their moves based on the news. Panic selling can occur on bad news, or over-exuberant buying can ensue when good news comes.
The Shooting Star pattern is part of the technical trading approach that started in 18th century Japan. A rice trader named Munehisa Homma used patterns in price charts to make his trades and made over $10 billion in today’s dollars.
Then Confucian scholars followed suit in China with a manual on price patterns. In the 19th Century, Charles Dow added average price movements.
All this together became known as technical trading and included the Shooting Star pattern.
Today, Jack Schwager is recognized as an expert on technical analysis. His book “Market Wizards” gives pointers on using The Shooting Star.
India’s Sudarshan Sukhani is well-known for technical analysis and serves as President of the Association of Technical Analysts.
The difference in Shooting Star patterns is the color. A Shooting Star is most reliable when it is red. This means the price closed down from the opening. However, it is still a Shooting Star if it is green because prices still failed to recover much. The red is considered the most reliable.

Tell yourself a story as you look at a Shooting Star. Upward prices drop dramatically.

Buyers initially drove the price up, but sellers took over and brought the price down. Prices closed near the low of the day. The body of the candle closes very near the lowest price. That means buyers failed to lift the price off its bottom.

The failure to rise back up may mean you should get ready to sell. The next day, prices drop.

As suggested by the Shooting Star, buyers continue to dominate.
You trade the Shooting Star pattern by waiting until just before the close of the trading day. At that point, you sell the position.
As you can see, the body reaches nearly to the low of the day. You can also see that prices extended far above the body. All of this together indicates sellers took over.
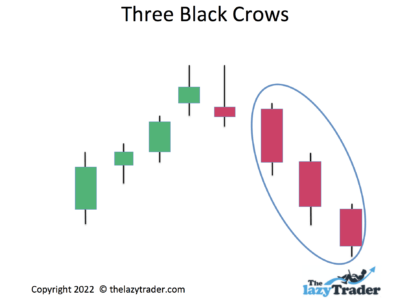
There is another pattern called Three Black Crows. You can watch for this pattern after a Shooting Star to see if there is confirmation that prices are starting a downtrend.
Prepare a strategy in advance so that you will know what to do when you see a Shooting Star. This will prevent emotional decision-making.
The Shooting Star is an exit indicator, so let’s assume you already entered the trade a while back and you have some profit built in.
You have three good choices for when to exit a position when you see the Shooting Star.
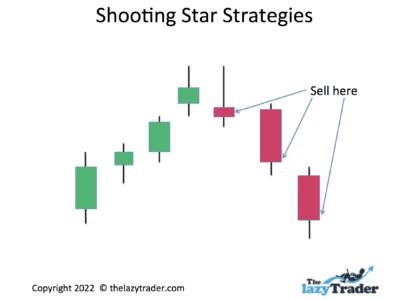
Which selling moment you choose depends on how much profit you have. If you just got in and only have a little profit, you may want to get out on the first day of a Shooting Star to protect what you have.
If you have been in the position for a while, choose one of the following days to get out. Remember, if you are wrong and prices go back up, you can always buy again.
Be prepared to make changes to the trade. You can sell a portion instead of selling it all, for example. Even though you should have a strategy, alter it according to what the market does.
If sudden bad news hits, you may get out on the first day and stay out, or if good news hits and prices bounce up, you may buy smaller portions to ease back into the position.
A Shooting Star pattern is one of the patterns that traders use. Learn a variety of patterns by keeping up with books, podcasts, videos, webinars, and newsletters. Start with the complete guide to candlestick trading. Here are some other learning resources for you:
Trade What You See How to Profit from Pattern Recognition by Larry Pesavento
This is a book to help you recognize patterns in charts. It is especially useful for learning to find patterns while they are developing instead of merely identifying them after they have developed.
Trading In The Zone by Mark Douglas)
This book on general trading principles covers things like eliminating bad habits and remaining consistent in your strategy. It shows how to trade probabilities and ignore anomalies. –
Udemy Technical Trading
Udemy offers a comprehensive guide to all aspects of technical trading and is a reliable source for valid information. Though they promote their own courses as part of this course, you won’t get come-ons to draw you into long-term commitments.
Travis Rose
This is a good place for beginners to start. Rose covers all the basics and leads you through the analysis of technical patterns.
Bullish Bears
A learn-as-you-go approach works well at Bullish Bears. You build your skills systematically while actually trading. You can elect to make practice trades with no actual money invested.
Read blogs offered by a pro with a track record. They should you through technical setups in marketplace. Here are some to look at:
Adam H. Grimes
Grimes has more than 20 years of experience and covers all types of trades, from breakouts to reversals of trends. His posts walk you through trades and keep you abreast of trends in the current marketplace.
Top-Down Charts
The emphasis here is on the macro trends. Great for learning how large trends affect individual charts. While you do want nuts-and-bolts training on how to trade, focusing on trends and the economy is essential to giving context to your trading strategies.
Marc to Market
This daily blog focuses on forex. Note that many of the technical trading principles of forex also apply to trading stocks.
Be aware that forums allow anyone to express an opinion. Take all advice in stride, as you don’t always know the credentials of the poster. Some popular ones:
Elite Trader
Elite Trader offers forums on every type of trading style and approach. It is a good idea to join discussions that may be outside of your current interests so you can learn about various methods. Look at the general technical forums first, then launch into technical forums on stocks, forex, commodities, etc.
Morningstar
Morningstar forums have some quality input from experienced technical traders. You won’t find any wild observations or insights here, but keep in mind that not everything in a forum is reliable.
Traders Laboratory
This is a discussion of ideas and strategies for both long-term and short-term trading.
Look for newsletters from seasoned pros. A good newsletter will give you tips and specific recommendations.
The Technical Indicator–Marketwatch
Here you will find in-depth chart analysis. This is the most helpful way to learn because each newsletter uses current technical setups. You can see actual patterns developing.
There are a many newsletters among the Morningstar offerings. Select areas of technical analysis, and follow them regularly to get a knack for spotting trends.
Choose an expert, not just someone selling courses.
Technical Analysis Radio – Interviews and tips on technical trading.
The Weekly Trend –This podcast covers all markets and focuses on technical analysis.
Anyone can post “advice” on YouTube. Make sure you are not buying into exorbitant promises of riches and “tricks” that “nobody wants you to know.” Here are some good places to start.
The Only Technical Analysis Video You Will Ever Need – While the claim in the title is a bit over-the-top, this 45-minute video takes you through many technical analysis examples in detail.
Candlestick Pattern Trading #8: What is a Shooting Star by Rayner Teo – Here you can walk through trades on various versions of the Shooting Star.
Candlestick School: Shooting Star Chart Pattern by UK Spreadbetting – This video gives details on recognizing and trading the Shooting Star.
Webinars can be sales pitches masquerading as instruction. Be careful.
Online Trading Academy – This provides solid advice on technical trading, with examples.
Technical Analysis–Fidelity – Fidelity is a reliable name, and the variety of technical trading webinars here adds a comprehensive and trustworthy series that can help you profit.
The Shooting Star forms in a day, and you must be ready to make a selling decision that day. You might wait for confirmation for a day or two, but the point is that you have to be decisive and quick.
You must be prepared to watch price action daily to catch this pattern the day it forms. Begin watching for the Shooting Star any time you have a stock that is in an uptrend.
Investing is not gambling. You are not throwing ideas out there in a desperate attempt to get rich quickly. Take your time and build wealth slowly, based on a series of level-headed trades. Do not expect overnight wealth.
You can limit your risk by placing no more than 1-2% of your account value into any trade. Never put more than that into any single asset purchase.
Avoid “tricks” and gimmicks. Use tried and true techniques that have lasted through the years. Do not make it up as you go. Learn from the resources above and choose strategies you understand, Then stick to them. Your emotions are no guide.
It is easy to overlook your losers and celebrate your winners. Take the time to track your trades and evaluate what you did right and wrong. Learn from yourself.
Look for a platform that offers candlestick charts. Here are some:
This platform allows traders to communicate like you do on Twitter and Facebook. You can share trading ideas and experiences with other traders. One helpful feature is the ability to examine professionally managed stock portfolios.
Ava offers platforms for multiple experience levels. You can automate your trades and follow expert traders to learn from their insights.
This platform is not available in the U.S. Naga allows you to copy the best traders on the platform. You can trade stocks, cryptocurrencies, and forex across the world.
This Forex and CD broker makes it easy for traders to start quickly. You can trade forex, stocks, commodities, metals, and cryptocurrencies.
FP uses the Autotrade tool. This allows traders to copy-trade, and it offers live statistics, along with risk-management systems. You can see the entire trading history of the most successful traders and mimic their methods.
The platform allows a low minimum deposit. Those trading for the first time can get started here. Free demo available.
This platform works well for technical traders. You can see a variety of charts to identify patterns, and this includes, of course, the Shooting Star pattern. You can go straight from the chart to placing a trade order. There is no cost for online trades; you can trade from your phone if you prefer. You can use the paperMoney account to practice trading without actually investing money.
This is a good place for beginners. You open a free account and get immediate access to the demo version. The site includes thousands of international stocks. When you decide to start investing, the minimum deposit is only $20. You will find good educational and research sources here.
You can trade stocks from 25 markets worldwide. Importantly, you can buy fractional shares. This is good for expensive stocks where one share can cost hundreds or even thousands of dollars. You can buy a fraction of a share for much less. The demo account, Active Trader Pro, allows you to place as many as 50 orders at once (no actual money is invested). You can use technical indicators and create your own charts.
You can access the free demo without even opening an account. Here you can “paper trade” thousands of stocks from the U.S., the U.K., and Europe. Even when you decide to open an account and invest real money, there is no charge for trades.
Trend – A Trend is a sustained price direction (either up or down). “Sustained” usually means weeks. For example, traders usually call a brief downtrend a “dip” or a “pullback.”
Uptrend – Prices tend upward for days, weeks, or months. The movement is not always up–there are some down days–but the overall trend moves higher.
Downtrend – Prices slope downward on a chart for days, weeks, or months.
Pattern – Over time, the price action will form a “shape.” Traders have come to recognize that these shapes have occurred throughout trading history.
One-day Pattern – The Shooting Star is one of several one-day patterns to watch for. It is a quick signal rather than a “shape” that forms over several days.
Reversal Pattern – A reversal is a change in price direction. There are reversal patterns when prices reach a top or a bottom. You should know both.
Exit or Sell Point – You can decide in advance of a purchase when you will get out. This can be a specific price or a percentage gain.
Stop-Loss Order – You place a sell order that automatically triggers if prices drop to a specific point. You choose this based on your tolerance for losses.
Getting Stopped Out – This happens when you set a stop-sell order too close to the current price. Normal fluctuations can cause the price to drop momentarily, triggering a sell order when you don’t want one.
Target Price – Many analysts name a target price for an investment, meaning they think it will rise to that point. Don’t follow these blindly. Analysts can be wrong.
Top – A “top” is the highest point an asset has reached in its current uptrend before turning downward.
The Shooting Star pattern can be your friend, helping you avoid losses and lock in profits. However, make sure it comes after an uptrend. While day traders may accept a few days as an uptrend, long-term investors watch for uptrends that last weeks and months.
A Shooting Star after a sustained uptrend is much more reliable than one that appears after prices have tickets up for only a few days. The idea is that there are no more buyers. They have had time to buy, and all that are left are sellers. Ask yourself if the Shooting Star you are looking at appears to be buyer exhaustion.
It is accurate about 59% of the time.
It is bearish, meaning it suggests prices will fall.
You sell your position when you see the Shooting Star or du8ing the following days if prices continue to drop.
Because it comes and goes quickly, falling fast.
Because it is a one-day pattern, it can be wrong.