If you're interested in trading CFD/Forex, technical analysis can provide a useful approach to making informed decisions. By analyzing price charts and identifying trends and patterns, you can gain valuable insight into the market's direction and potentially increase your chances of making profitable trades while at the same time mitigating risk.
Technical indicators, such as oscillators, moving averages, and trend lines, can help confirm trends, identify potential reversals, and generate trading signals. Once you have identified a trend and confirmed it with technical indicators, you can develop a trading plan that includes clear entry and exit points, stop-loss levels, and profit targets.
In this comprehensive guide, we will delve into the basics of technical analysis and explore how it can be used to trade CFD/Forex. Technical analysis is a powerful tool you can use to make conscioustrading choices in the market. By following the steps outlined in this guide, you can learn how to analyse price charts, identify trends and patterns, use technical indicators, and develop a solid trading plan. This guide will equip you with the knowledge and skills needed to improve your trading strategies and potentially increase your chances of success.
Understanding Technical Analysis
To effectively use technical analysis in trading, it's essential to have a grasp of the fundamentals behind this approach. Technical analysis is based on the premise that an asset's price history can provide insights into its future price movements. You use charts and technical indicators to analyse trends, patterns, and signals that can aid you in making trading decisions.
Technical analysis is guided by three key principles:
- Price Discounts Everything: Technical analysts believe that an asset's value is entirely reflected in its price. Therefore, with this principle, you can concentrate on analyzing price movements rather than external factors such as economic indicators or news events.
- Price Movements Tend to Repeat: Some technical analysts contend that price movements follow patterns that can be recognized and analyzed. By understandingthese patterns, you can anticipate future price movements.
- Trends Persist Until They Don't: Others posit that trends tend to continue until there is a definite signal that they are shifting. You can use technical indicators to recognize these signals and adjust your trading strategies accordingly.
Using Technical Analysis in CFD Forex Trading
Now that we understand the basics of technical analysis, let's explore how to use it in CFD/Forex trading. Here are 4 easy steps you can follow:
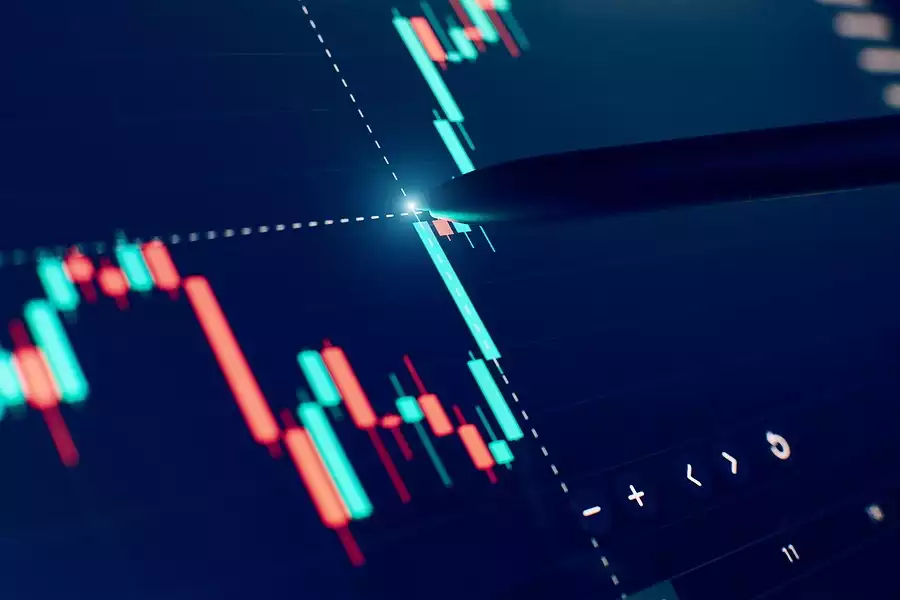
Choose the Right Chart: The first step in using technical analysis is to choose the right chart. There are several different types of charts, including line charts, bar charts, and candlestick charts. Each type of chart has its advantages and disadvantages, so it's important to choose the one that works best for you.
Bar Chart: Providing more detailed information than a line chart, the bar chart displays the open, high, low, and close prices of an asset for each time period. Each bar represents a specific time interval, and its height indicates the price range during that period. Bar charts help identify price patterns and measure volatility.
Candlestick Chart: Candlestick charts are visually appealing and widely used. They resemble bar charts but provide additional information. Each candlestick represents a specific time interval and displays the open, high, low, and close prices. The body of the candlestick is coloured to indicate if the price closed higher (bullish) or lower (bearish) than it opened. Candlestick charts are valuable for recognizing trend reversals and patterns.
Heikin-Ashi Chart: Heikin-Ashi charts are a variation of candlestick charts that employ modified calculations to generate smoother candlestick patterns. These charts are particularly helpful in identifying trends and reducing market noise.
Renko Chart: Renko charts focus solely on price movement, disregarding time intervals. They use bricks or blocks to represent price changes, forming new bricks only when the price moves by a specific predefined amount. Renko charts effectively filter out minor price fluctuations and emphasize significant price movements.
Identify Trends: The next step is to identify trends in the market. You can look for patterns of higher highs and higher lows in an uptrend and lower highs and lower lows in a downtrend. Once a trend has been identified, you can use it to inform their trading decisions.
Uptrend: When the price of an asset consistently moves upward, forming higher highs and lows, it indicates an uptrend. With an uptrend, you can seek buying opportunities in this bullish market sentiment.
Downtrend: In a downtrend, the price of an asset consistently moves downward, forming lower highs and lows. With this type of trend you, you may consider selling or shorting opportunities in this bearish market sentiment.
Sideways or Range-bound Trend: In a sideways trend, the price of an asset fluctuates within a narrow range, lacking a clear upward or downward direction. You can identify opportunities within this range by buying at support levels and selling at resistance levels.
Use Technical Indicators: Technical indicators are mathematical calculations that use historical price and volume data to identify patterns and trends. There are many different types of indicators, including moving averages, oscillators, and trend lines. Using these indicators, you can confirm trends, identify potential reversals, and generate trading signals.
Develop a Trading Plan: Once you have identified a trend and confirmed it using technical indicators, the next step is to develop a trading plan. This plan should outline your entry and exit points, stop-loss levels, and profit targets. By having a clear plan in place, you can make better decisions in trading and avoid emotional reactions to market movements.
The top 10 most common Technical Indicators:
The 10 most commonly used technical indicators are mathematical calculations based on an asset's price and/or volume. Learning about these indicators can help you improve your overall chances of success.
Moving Averages: This indicator measures the average price of an asset over a specified period. It helps you identify the trend of the asset, and can also be used to generate trading signals when the price crosses above or below the moving average.
Relative Strength Index (RSI): The RSI is an indicator that measures the magnitude of recent price changes to evaluate overbought or oversold conditions in the market. It oscillates between 0 and 100, with values above 70 indicating overbought conditions and values below 30 indicating oversold conditions.
Stochastic Oscillator: This indicator measures the momentum of an asset by comparing its closing price to its price range over a specified period. It oscillates between 0 and 100, with values above 80 indicating overbought conditions and values below 20 indicating oversold conditions.
Bollinger Bands: The Bollinger Bands indicator measures the volatility of an asset by plotting two standard deviations above and below a moving average and also helps identify overbought and oversold conditions and potential reversal points.
Moving Average Convergence Divergence (MACD): This indicator measures the difference between two moving averages and plots a histogram that oscillates above and below a zero line. The MACD helps identify trend direction and momentum, as well as potential buying and selling opportunities.
Fibonacci Retracement: This indicator uses Fibonacci ratios to identify potential levels of support and resistance in an asset's price. These levels identify potential entry and exit points.
Ichimoku Cloud: This indicator uses several moving averages and other components to provide a comprehensive view of an asset's trend, momentum, and potential support and resistance levels.
Average Directional Index (ADX): This indicator measures the strength of a trend and can help determine whether a trend is likely to continue or reverse. It oscillates between 0 and 100, with values above 25 indicating a strong trend.
On-Balance Volume (OBV): This indicator uses volume to measure buying and selling pressure in the market. It helps you to identify potential trend reversals and confirm the strength of a trend.
Parabolic SAR: This indicator uses a trailing stop and reverse mechanism to identify potential trend reversals. It places dots above or below the price of an asset to indicate potential reversal points.
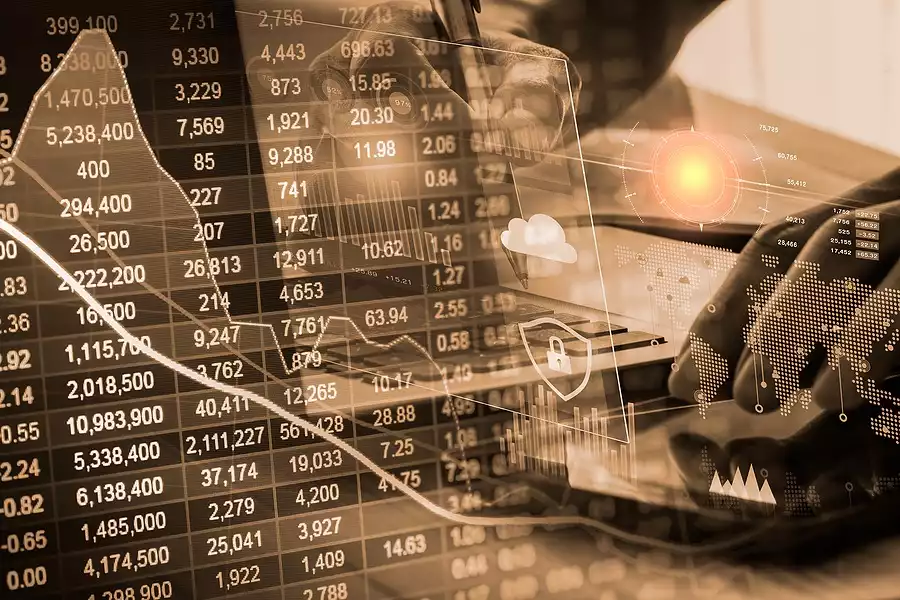
Automated Trading Systems for Technical Analysis in CFD/Forex
Automated trading systems, including expert advisors, algorithmic trading, and social trading, are becoming increasingly popular among traders for their ability to remove emotions from the equation and execute trades based on predefined rules. However, it's essential to keep in mind that these systems are not infallible and cannot predict unexpected news events or shifts in market sentiment. By combining technical analysis with automation, you can achieve greater success in CFD Forex trading with dedication and practice.
If you're interested in exploring CFD/Forex trading, Eightcap is a reputable broker that provides multiple trading platforms like MetaTrader 4 and MetaTrader 5. They also offer advanced tools like Capitalise.ai to help automate your trading strategies. Visit their website at https://www.eightcap.com/en/ to learn more.
Automated trading systems utilize computer algorithms to analyze the market, identify trends, and execute trades automatically that can help you minimize impulsive decisions.
Although automated trading systems have their advantages, they are not foolproof and cannot replace the experience and intuition of a skilled trader. Unexpected news events or changes in market sentiment can significantly impact their effectiveness. However, with a systematic approach to CFD/Forex trading, automated trading systems can be a useful tool for you to enhance your trading strategies.
Conclusion
Making informed decisions in trading is absolutely crucial, and with technical analysis, if you know what you are doing, this can be achieved. By studying price charts to identify trends and patterns that provide valuable insights into market direction, you can improve your understanding of market movements, potentially increasing the likelihood of profitable trades while simultaneously reducing risk.
At Eightcap, you can access advanced trading platforms like MetaTrader 4 and MetaTrader 5, which offer a wide range of technical indicators. Additionally, you can utilize Capitalise.ai, an automation tool with a user-friendly interface that enables traders without any prior coding experience to create an automated trading function using plain English.
To effectively incorporate technical analysis into your trading strategy, you should begin by mastering the fundamentals of chart patterns, indicators, and trends. You can then select a trading platform that provides access to various technical indicators and test their strategies on a demo account without risking real money. It is crucial to develop a robust trading plan that includes clear entry and exit points, stop-loss levels, and profit targets before engaging in real-money trading.
In summary, technical analysis significantly improves a trader's prospects in trading. By analyzing price charts and utilizing technical indicators, you can gain valuable insights into market fluctuations, recognise pattern developments and confirm insights from economic news.