There is a definite seasonal bias for gold, which can mean that, come the festive period, it's a nice way to bump up the Christmas fund. And of course, if you miss the day trading, the weekly timeframe will do nicely as well - gold has that kind of comforting reputation about it.
There is a definite seasonal bias for gold, which can mean that, come the festive period, it's a nice way to bump up the Christmas fund. And of course, if you miss the day trading, the weekly timeframe will do nicely as well - gold has that kind of comforting reputation about it.
The firm's main research and development office is based in Tel Aviv Israel. It originally specialized in Forex and indices spreadbetting and CFDs but has recently expanded in stock trading also.
At the time of writing, eToro has 2.2 out of 5 star on Trust pilot. The comments suggest that the platform offers some impressive features but withdrawing money can be difficult. Having said that, some of the negative reviews appear to be rants rather than constructive criticism. This can be examples of traders losing money through their own recklessness rather than eToro's fault. You should therefore take this reviews with a pinch of salt.
“the platform offers some impressive features but withdrawing money can be difficult.”
76% of retail investor accounts lose money when trading CFDs with this provider.
OANDA is a global financial services company providing advanced currency solutions to both retail and corporate clients all over the world. In this article, we are going to review this broker’s trading options, tools, platforms, spreads, commissions, security measures, and educational resources to help traders make the right choice.
76.6% of retail investor accounts lose money when trading CFDs with this provider. You should consider whether you understand how CFDs work and whether you can afford to take the high risk of losing
AvaTrade offers a wide variety of trading solutions (spread trading, CFDs, and social trading), and peace of mind with its comprehensive regulation, covering the EU, Australia, Canada and South Africa. Clients can use a variety of platforms for discretionary and automated trading.
76% of retail investor accounts lose money when trading CFDs with this provider.
Offers multiple asset classes, platforms, and regulated in a variety of regions. Caters for a global audience. Awarded with the Highest Overall Customer Satisfaction Award for 5 years running - Investment Trends CFD Report 2015.
A standalone copy-trading ecosystem, providing equities, foreign exchange, commodities and cryptocurrencies markets. Provides a global selection of brokerages.
Pepperstone is a global regulated broker that provides its clients with the latest technologies for trading multiple assets such as Forex, indices, cryptocurrencies, stocks, ETFs, and commodities. This article provides an overview of its trading platforms, tools, fees, protection measures, and other aspects to help traders make a more informed decision.
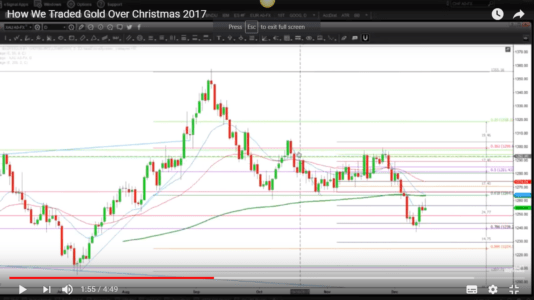
Knowing as we do that there is a season bias in gold where it will go up during December, into January and even perhaps into February, the seemed little doubt that trading gold was the way to go at this time of year. This is where understanding the past markets and doing research pays off. Since this is something that happens each year, we can - with a fair amount of certainty (although remember that nothing is 100 percent certain in trading) assume that it will happen again. And it does.
More Than Just A Hunch
There is more to how we traded gold than just looking to the past and having a hunch that the same will happen though. There are technical pointers that show us what's happening too. These include a Fibonacci cluster (we can look at the low of November 2015 and see that we're now at the three two Fibonacci retracement, and if we take it from the higher low from this time in 2016, we can see that the recent bullish pin bar reversal totally rejected the 50 percent Fibonacci). On top of all of that, there is the completion of the ABCD pattern with a Fibonacci extension from A to B of 1.618.
High Lows Give Us Hints
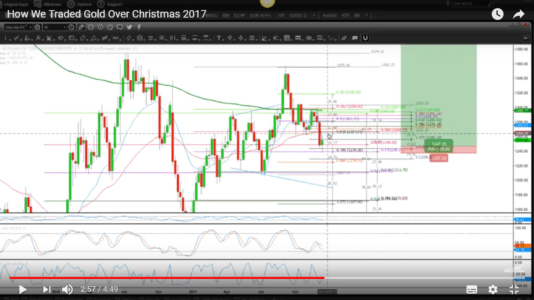
Now that we can see three higher low, the reasoning behind how we traded gold becomes even more cleaner. So you should start, if you're not in gold already, by trading the break of last week's high.
Have an entry above last week's high and a stop loss below the low and you should be all set. As for what return you might realise, since the swing has gone towards the 1.618 historically, it makes sense to suggest that the return could be the same again, and that makes a 7.6 percent reward to risk ratio, which could be a rather interesting 15 or 16 percent gain if you're risking two percent. That's why we like to trade gold, and why we want you to know how we traded gold!