Technical analysis is the process of studying price movement in order to identify patterns, find trends, support & resistance levels and generally learning to 'read' a market's movements. What is technical analysis is achieved through learning about the use of charts, price movement, indicators and other analysis tools which we will look to cover.
Technical analysis is the process of studying price movement in order to identify patterns, find trends, support & resistance levels and generally learning to 'read' a market's movements. What is technical analysis is achieved through learning about the use of charts, price movement, indicators and other analysis tools which we will look to cover.
The firm's main research and development office is based in Tel Aviv Israel. It originally specialized in Forex and indices spreadbetting and CFDs but has recently expanded in stock trading also.
At the time of writing, eToro has 2.2 out of 5 star on Trust pilot. The comments suggest that the platform offers some impressive features but withdrawing money can be difficult. Having said that, some of the negative reviews appear to be rants rather than constructive criticism. This can be examples of traders losing money through their own recklessness rather than eToro's fault. You should therefore take this reviews with a pinch of salt.
“the platform offers some impressive features but withdrawing money can be difficult.”
76% of retail investor accounts lose money when trading CFDs with this provider.
OANDA is a global financial services company providing advanced currency solutions to both retail and corporate clients all over the world. In this article, we are going to review this broker’s trading options, tools, platforms, spreads, commissions, security measures, and educational resources to help traders make the right choice.
76.6% of retail investor accounts lose money when trading CFDs with this provider. You should consider whether you understand how CFDs work and whether you can afford to take the high risk of losing
AvaTrade offers a wide variety of trading solutions (spread trading, CFDs, and social trading), and peace of mind with its comprehensive regulation, covering the EU, Australia, Canada and South Africa. Clients can use a variety of platforms for discretionary and automated trading.
76% of retail investor accounts lose money when trading CFDs with this provider.
Offers multiple asset classes, platforms, and regulated in a variety of regions. Caters for a global audience. Awarded with the Highest Overall Customer Satisfaction Award for 5 years running - Investment Trends CFD Report 2015.
A standalone copy-trading ecosystem, providing equities, foreign exchange, commodities and cryptocurrencies markets. Provides a global selection of brokerages.
Pepperstone is a global regulated broker that provides its clients with the latest technologies for trading multiple assets such as Forex, indices, cryptocurrencies, stocks, ETFs, and commodities. This article provides an overview of its trading platforms, tools, fees, protection measures, and other aspects to help traders make a more informed decision.
Chaotic technical analysis
One technical analysis theory is that although markets are chaotic (which any trader will know is true!), price action is not completely random. This gives the opportunity for a trader to look at historical price movements, such as candlestick patterns, and determine the current trading conditions and potential price movement. As a result traders look for similar patterns that have formed in the past, and will form trade ideas believing that price will act the same way that it did before.
I will be the first person to tell you that technical analyses is more of an art than a science!
This 'art' will be developed as you gain experience which will improve your technical analysis skills. Many hedge funds and large banks having advanced computer systems constantly analysing markets. It is therefore rare to see any major inconsistency last longer than seconds. Therefore many traders turn to FOREX technical analysis. Technical analysis presumes that economic, political and psychological factors have already been priced into the exchange rate by the market.
The importance of charts
In the world of FOREX, when a trader asks what is technical analysis, the first thing that comes to mind is a chart. Technical analysts use charts because they are the easiest way to visualize historical data. Looking at past data helps you spot trends and patternswhich could help you find some great trading opportunities.
Patterns on charts tend to repeat themselves, which gives an edge to the trader who can spot them. Although algorithmic trading has increased in importance, most price movements are driven by humans. They tend to prefer the comfort of repetition rather than the risk of something new.
Price charts gives us a picture of the price levels that the market participants have deemed important. By focusing your analysis on a market's price chart you can streamline your trading. You can then focus on the reaction of markets to particular kinds of news.
With so many traders relying on working out what is technical analysis, price patterns have a tendency to become self-fulfilling. Just because several traders are looking at the same chart with the same patterns, does not necessarily mean they will draw the same conclusions.
You should realise that technical analysis is subjective!
The technical in what is technical analysis!
A key goal of working out what is technical analysis for any trader in the FOREX market is to determine whether a graph will trend in a certain direction, or if it will travel sideways and remain range-bound. To determine these characteristics, draw trend lines that connect historical levels that have prevented a rate from heading higher or lower. These levels of support and resistance are used by technical traders to determine whether or not the given trend, or lack of trend, will continue. A trader therefore spends their time:
Identifying support & resistance levels through price charts
Working out if the market is going to move up, down or sideways
FOREX Prices typically move in an up and down fashion. In effect zig -zagging their way in whichever direction that particular price is going. These zig-zags will display two forms of patterns:
Range trading - when prices zigzag sideways
Trend - where prices are going in a distinct direction
Although it is beyond the scope of this article, having an understanding of Fibonacci retracement, Bollinger bands and pivot points would be useful as these indicators are popular as they help to generate signals.
Technical analysis of a market will help you determine when and where to enter a market. Importantly, it was also help show you when to get out.
Conclusion:
Remember, there is no magical combination of technical indicators that will unlock some sort of secret trading strategy. The secret ofsuccessful trading is good risk management, discipline, and the ability to control your emotions. Anyone can guess right and win every once in a while. To trade profitably consistently, means knowing what is technical analysis. Good luck with those first intrepid steps on your journey to becoming a successful technical analysis trader!


 This 'art' will be developed as you gain experience which will improve your technical analysis skills. Many hedge funds and large banks having advanced computer systems constantly analysing markets. It is therefore rare to see any major inconsistency last longer than seconds. Therefore many traders turn to FOREX technical analysis. Technical analysis presumes that economic, political and psychological factors have already been priced into the exchange rate by the market.
 Patterns on charts tend to repeat themselves, which gives an edge to the trader who can spot them. Although algorithmic trading has increased in importance, most price movements are driven by humans. They tend to prefer the comfort of repetition rather than the risk of something new.
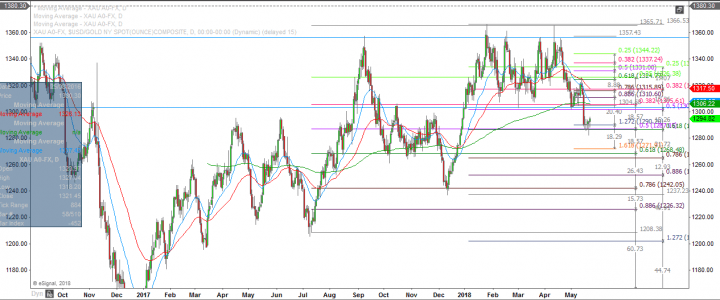 A key goal of working out what is technical analysis for any trader in the FOREX market is to determine whether a graph will trend in a certain direction, or if it will travel sideways and remain range-bound. To determine these characteristics, draw trend lines that connect historical levels that have prevented a rate from heading higher or lower. These levels of support and resistance are used by technical traders to determine whether or not