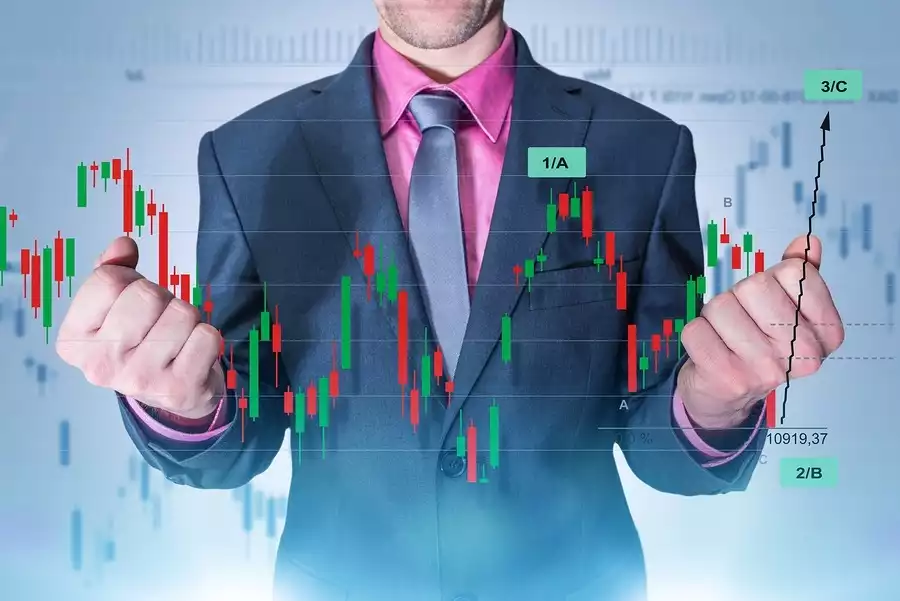
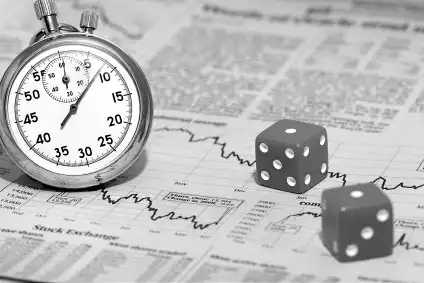
Do you ever wonder how much information you really need to make an informed decision about a trade idea? How much analysis is too little? What amount can be considered "just right,"? At what point do you have so much that you run the risk of the dreaded "analysis paralysis?"
Do you ever wonder how much information you really need to make an informed decision about a trade idea? How much analysis is too little? What amount can be considered "just right,"? At what point do you have so much that you run the risk of the dreaded "analysis paralysis?"
The firm's main research and development office is based in Tel Aviv Israel. It originally specialized in Forex and indices spreadbetting and CFDs but has recently expanded in stock trading also.
At the time of writing, eToro has 2.2 out of 5 star on Trust pilot. The comments suggest that the platform offers some impressive features but withdrawing money can be difficult. Having said that, some of the negative reviews appear to be rants rather than constructive criticism. This can be examples of traders losing money through their own recklessness rather than eToro's fault. You should therefore take this reviews with a pinch of salt.
“the platform offers some impressive features but withdrawing money can be difficult.”
76% of retail investor accounts lose money when trading CFDs with this provider.
OANDA is a global financial services company providing advanced currency solutions to both retail and corporate clients all over the world. In this article, we are going to review this broker’s trading options, tools, platforms, spreads, commissions, security measures, and educational resources to help traders make the right choice.
76.6% of retail investor accounts lose money when trading CFDs with this provider. You should consider whether you understand how CFDs work and whether you can afford to take the high risk of losing
AvaTrade offers a wide variety of trading solutions (spread trading, CFDs, and social trading), and peace of mind with its comprehensive regulation, covering the EU, Australia, Canada and South Africa. Clients can use a variety of platforms for discretionary and automated trading.
76% of retail investor accounts lose money when trading CFDs with this provider.
Offers multiple asset classes, platforms, and regulated in a variety of regions. Caters for a global audience. Awarded with the Highest Overall Customer Satisfaction Award for 5 years running - Investment Trends CFD Report 2015.
A standalone copy-trading ecosystem, providing equities, foreign exchange, commodities and cryptocurrencies markets. Provides a global selection of brokerages.
Pepperstone is a global regulated broker that provides its clients with the latest technologies for trading multiple assets such as Forex, indices, cryptocurrencies, stocks, ETFs, and commodities. This article provides an overview of its trading platforms, tools, fees, protection measures, and other aspects to help traders make a more informed decision.
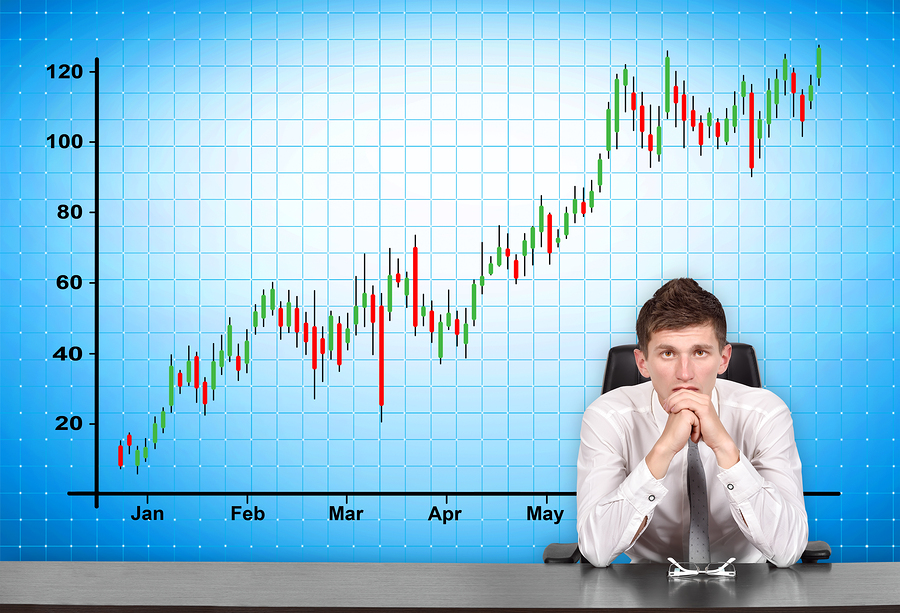
These are all rather relative questions considering some traders may feel confident acting on a trade idea with little more than a chart pattern and some hope on their side. Others like to consider practically every technical, fundamental, and hybrid factor imaginable before trading. Believe it or not, there's even an indicator that keys off of the price of a McDonald's Big Mac! Inevitably some traders and investors inevitably use it!
To help you conduct the "right" amount of analysis for you, there are seven questions you may want to consider when analysing a particular trade idea. Once you have sufficiently answered these, you will have developed a sound enough understanding of the trading landscape to act confidently. This you can achieve without trading fear. Nor will you be conflicted whilst trying to analyse too much.
Trade with the Market's Prevailing Trend
Trading with the trend in your favour is an important premise of successful trades. If your answer to the title question is "No," then it very well could result in the invalidation of the initial trade idea. Reversal tradesare valid and even advisable from time to time when enough factors are working in their favour. Day in and day out, the most prudent trades will be those taken in the direction of the trend. To discern whether the "Trend is your friend," simply check out the price action on the chart. Draw a simple trend line to see whether the market in question is in a sustained uptrend or downtrend. Indeed it is worth checking if there is a range in play.
When trading an uptrending market, the strongest trade idea would be to buy pullbacks. In an overall downtrend, selling rallies would be most advisable. Finally, when trading in sideways market conditions, you will likely trade your best by buying at or near the bottom of the range. Clearly selling at or near the top is a good idea.
What's the Reward/Risk Profile?
In addition to the technical validity of the set-up, nothing will excite a trader than an exemplary risk reward ratio. Conversely, few factors will cause a trader to give up on a trade idea faster than the realization that the reward is not worth the risk. That is why it is crucial to analyse reward/risk profile and never trade unless it is working decidedly in your favour. 'Missing' a trade opportunity is not the end of the world, there will be another around the corner. Losing a portion of your capital because you rushed into a risky trade is painful. The loss of money is obvious, but the confidence knock will be harder to quantify.
Calculating reward/risk profile
Reward: Number of pips between potential entry point and initial price target, divided by…
Risk: Number of pips between potential entry point and location of a protective stop-loss
Most traders will require at least 2:1, and plenty strongly prefer 3:1 or higher. This allows themr to justify placing their hard-earned account capital to work in the markets. We use 2:1 as a required minimum but often take trades that promise reward/risk in excess of 4:1. The latter we do when coupled with a strong chart pattern always makes for a trade idea you can pursue with confidence.
Which Price Patterns Inspire the Trade Idea?
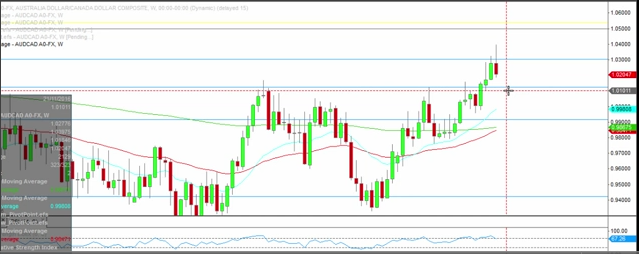
For technical traders, it goes without saying that most any trade idea must have a valid chart pattern(s) at its core. And note the mention of patterns, plural, in this case, too, as often, as we saw with this historical example of AUDCAD set-up below. There can be more than one chart pattern in play at one time.
Here, in particular, there's the apparent completion of an AB=CD type of pattern. This occurrs before the pin bar reversal that might ultimately be used as a trigger to sell the pair at or near horizontal resistance overhead. Can you spot both price patterns on the chart?
Technical Analysis: Short Trade Example for AUDCAD
This, of course, is a reversal trade that is decidedly higher risk and lower probability. Yet the proven and verifiable price patterns create a technical basis for this trade idea. It is one that was worthy of consideration nonetheless.
That would not have been the case if one or both of those price patterns had been invalidated. For example, if the "AB" leg of the rally from about the 0.9400 level did not equal the length of the "CD" leg. This is especially the case if the bearish pin bar reversal that printed up near the 1.03 level were not testing that key horizontal resistance level. So herein lies the importance of valid price patterns. It is why no trade idea should ever be considered by technical traders in the absence of one pattern.