Technical analysis is a vast universe to say the very least. I mean, just think of all the chart patterns that are out there, and that we stand to encounter quite regularly when trading. From the simplest chart formations, which may include dojis, pin bars, engulfing candles and pivots, to the more complex chart patterns like multi-wave retracements, it takes knowledge and experience to develop pattern recognition skills, and often, it's hard even figuring out where to begin.
The firm's main research and development office is based in Tel Aviv Israel. It originally specialized in Forex and indices spreadbetting and CFDs but has recently expanded in stock trading also.
At the time of writing, eToro has 2.2 out of 5 star on Trust pilot. The comments suggest that the platform offers some impressive features but withdrawing money can be difficult. Having said that, some of the negative reviews appear to be rants rather than constructive criticism. This can be examples of traders losing money through their own recklessness rather than eToro's fault. You should therefore take this reviews with a pinch of salt.
“the platform offers some impressive features but withdrawing money can be difficult.”
76% of retail investor accounts lose money when trading CFDs with this provider.
OANDA is a global financial services company providing advanced currency solutions to both retail and corporate clients all over the world. In this article, we are going to review this broker’s trading options, tools, platforms, spreads, commissions, security measures, and educational resources to help traders make the right choice.
76.6% of retail investor accounts lose money when trading CFDs with this provider. You should consider whether you understand how CFDs work and whether you can afford to take the high risk of losing
AvaTrade offers a wide variety of trading solutions (spread trading, CFDs, and social trading), and peace of mind with its comprehensive regulation, covering the EU, Australia, Canada and South Africa. Clients can use a variety of platforms for discretionary and automated trading.
76% of retail investor accounts lose money when trading CFDs with this provider.
Offers multiple asset classes, platforms, and regulated in a variety of regions. Caters for a global audience. Awarded with the Highest Overall Customer Satisfaction Award for 5 years running - Investment Trends CFD Report 2015.
A standalone copy-trading ecosystem, providing equities, foreign exchange, commodities and cryptocurrencies markets. Provides a global selection of brokerages.
Pepperstone is a global regulated broker that provides its clients with the latest technologies for trading multiple assets such as Forex, indices, cryptocurrencies, stocks, ETFs, and commodities. This article provides an overview of its trading platforms, tools, fees, protection measures, and other aspects to help traders make a more informed decision.
Nonetheless, taking a logical, methodical approach to your early trading education is crucial to getting a proper start in trading. So whatever you do, don't jump wildly between chart patterns in a frantic attempt to learn them all right away. Instead, follow this advice and master some of the most relevant chart patterns first. Doing so will create a proper foundation of knowledge upon which you can build a lasting trading career.Here's where to start…
Learn About Trend Lines First and Foremost
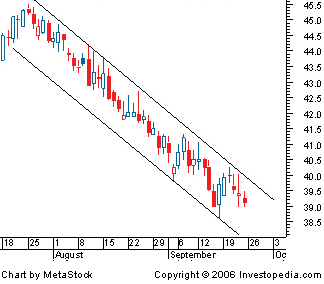
Because price itself forms the entire basis for technical analysis, perhaps the first vital skill for technical traders to develop is an ability to decipher the direction (and perhaps strength) of a market's prevailing trend. And that can be as simple as drawing and analysing trend lines—and perhaps moving averages—on the chart. Believe it or not, trend lines are chart patterns, too, and because trend lines help feed into other chart patterns, they make a fine first step for new and aspiring traders. To get started with trend lines, simply practice drawing lines connecting a market's highs and/or lows (as shown at right) to get a picture of the prevailing trend, which in this case is clearly and decisively down and within the context of a channel, or flag formation. This might signal to the trader that the best way to trade this particular market or asset is to sell tests of the upper trend line, which acts as key resistance, and buy tests of the lower one, which acts as support.
As it happens, trend lines coupled with our own preferred price pattern, the pin bar reversal, are used under the Lazy Trader methodology to signal high-probability trading opportunities in up, down, and sideways markets.
Next, Get Familiar with Continuation Chart Patterns
Continuation patterns often give rise to trading opportunities that are consistent with the market's prevailing trend. And in part, this is why using trend lines to first determine the market's bias is the recommended first step, because continuation (or consolidation) patterns will only apply if traded in that particular direction. The most well-known continuation patterns include various types of triangles, from the symmetrical triangle patterns seen at right (Source: Investopedia), to ascending and descending triangle patterns (not shown). Ascending and descending triangles are asymmetrical in nature, with ascending triangles only occurring for uptrends, and descending triangles only occurring for downtrends.
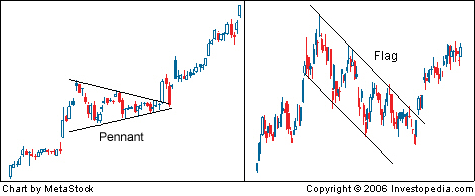
Meanwhile, the pennant and flag formations seen below are other (similar) continuation chart patterns that belong in this same family. Both can occur in either uptrending or downtrending markets, and while many traders use these chart patterns as a basis for planning and executing trades, pure price action traders like us aim only to recognise their presence and use them to help validate existing, price-action-generated trade ideas.
And Finally, Spend Time Learning About Reversal Patterns
Reversal patterns are used to suggest a potential change in the market's direction. And, because trendreversals carry lower probability and comparatively higher risk, we recommend first working towards a mastery of both trend lines and perhaps continuation patterns before you truly focus your attention here. Afterall, you may well be able to trade successfully using little more than trend lines and pure price action, anyway.
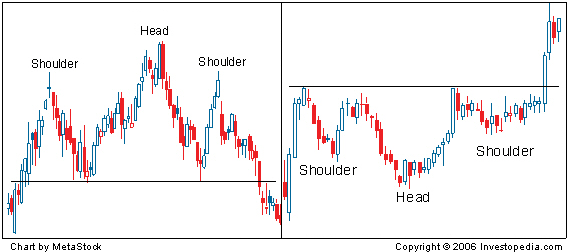
Among the more common chart patterns used to signal potential trend reversals are double tops and double bottoms, the popular head and shoulders pattern (see below), and triple top and triple bottom patterns. Note that the standard head and shoulders pattern (left panel) willsignal a top for the given market or asset and a subsequent reversal to the downside, while the inverse head and shoulders pattern (right panel only) is a bottoming formation that would precede a move back to the up side.
Conclusion
For new and aspiring technical traders, there's always a lot to learn, but if you take but one piece of advice from this article, make it this: Being sensible and targeting only one or two prominent chart patterns at a time early on will serve you much better than trying to absorb many different patterns all at once will.
So start with basic trend lines, and perhaps simple formations like pin bars, dojis, inside bars, and the like. Next, begin to study continuation and reversal patterns, but not necessarily so you can trade them. Learn to recognise these common chart patterns to improve and help validate your market analysis, and promote more informed, confident trading for the long term.


 Because price itself forms the entire basis for
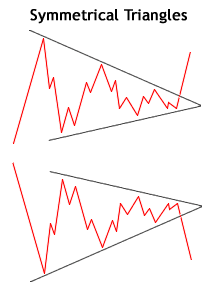 Continuation patterns often give rise to trading opportunities that are consistent with the market's prevailing trend. And in part, this is why using trend lines to first determine the market's bias is the recommended first step, because continuation (or consolidation) patterns will only apply if traded in that particular direction. The most well-known continuation patterns include various types of triangles, from the symmetrical triangle patterns seen at right (Source: