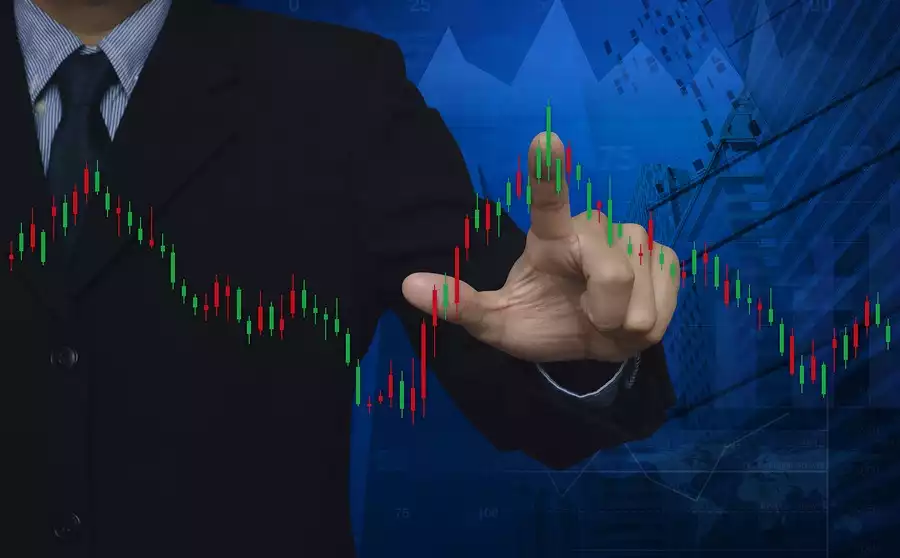
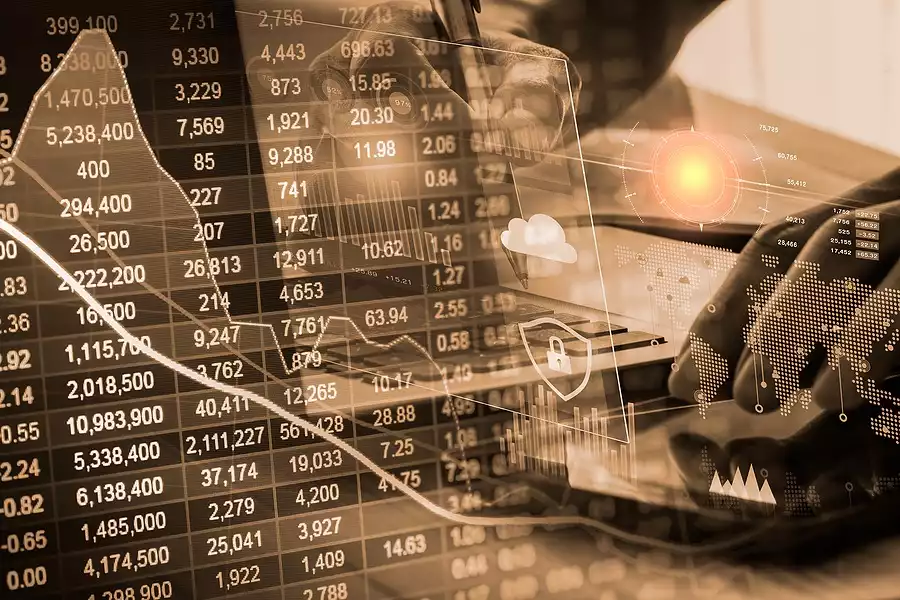
With so much exciting (and tradeable) price action happening across different markets, currency pairs and cryptocurrency trading we are now seeing an influx of valid, strong technical signals. Some of which have not been around for a little while. Read on to learn more about the hammer and smash bar formations, what each means to traders. You will also find out how to react whenever one of these strong technical analysis signals flashes on your screen.
The firm's main research and development office is based in Tel Aviv Israel. It originally specialized in Forex and indices spreadbetting and CFDs but has recently expanded in stock trading also.
At the time of writing, eToro has 2.2 out of 5 star on Trust pilot. The comments suggest that the platform offers some impressive features but withdrawing money can be difficult. Having said that, some of the negative reviews appear to be rants rather than constructive criticism. This can be examples of traders losing money through their own recklessness rather than eToro's fault. You should therefore take this reviews with a pinch of salt.
“the platform offers some impressive features but withdrawing money can be difficult.”
76% of retail investor accounts lose money when trading CFDs with this provider.
OANDA is a global financial services company providing advanced currency solutions to both retail and corporate clients all over the world. In this article, we are going to review this broker’s trading options, tools, platforms, spreads, commissions, security measures, and educational resources to help traders make the right choice.
76.6% of retail investor accounts lose money when trading CFDs with this provider. You should consider whether you understand how CFDs work and whether you can afford to take the high risk of losing
AvaTrade offers a wide variety of trading solutions (spread trading, CFDs, and social trading), and peace of mind with its comprehensive regulation, covering the EU, Australia, Canada and South Africa. Clients can use a variety of platforms for discretionary and automated trading.
76% of retail investor accounts lose money when trading CFDs with this provider.
Offers multiple asset classes, platforms, and regulated in a variety of regions. Caters for a global audience. Awarded with the Highest Overall Customer Satisfaction Award for 5 years running - Investment Trends CFD Report 2015.
A standalone copy-trading ecosystem, providing equities, foreign exchange, commodities and cryptocurrencies markets. Provides a global selection of brokerages.
Pepperstone is a global regulated broker that provides its clients with the latest technologies for trading multiple assets such as Forex, indices, cryptocurrencies, stocks, ETFs, and commodities. This article provides an overview of its trading platforms, tools, fees, protection measures, and other aspects to help traders make a more informed decision.
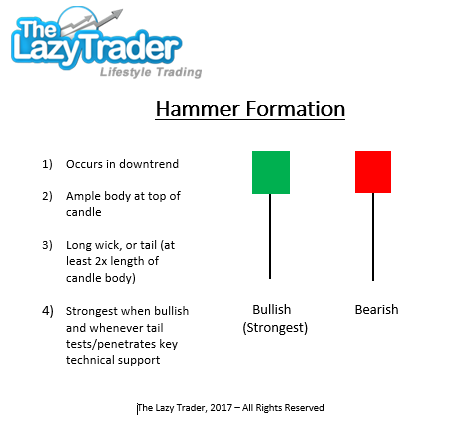
Strong Technical Signals: Hammer
A hammer is a single-bar chart pattern that occurs only in down markets. It signals a potential buying opportunity in advance of a reversal to the upside. This signal is not to be confused with a hanging man. This is important to note considering the two are identical in their construction. The only difference being that a hammer is seen at the end of a downtrend. A hanging man occurs in upward-trending markets and suggests weakening momentum.
What Does a Hammer Look Like?
Hammer bars get their name from their construction. This involves the candle's body being set at the very top of the tail, or "handle." To qualify as a hammer, the general rule is that the tail must be at least twice as long as the candle's body. (See diagram at right.) Traditional hammer bars can be either bullish or bearish. They would still be considered strong technical signals, although the bullish kind are considered even more favourable. So, too, is any hammer bar that prints on higher time frames like the daily, and especially the weekly and monthly charts.
Now take a good look at the hammer's construction for a moment. Can you see that if only the tail had a "shadow," or extended a bit above the bar, the hammer would likely be classified as a pin bar reversal instead?
What Does It Tell about Price Action?
Much like a pin bar reversal does, a hammer on a chart of any time frame signals renewed buying coming in amidst a loss of selling momentum. This makes for a higher likelihood of a reversal to the upside at that point. This is particularly the case when the hammer occurs at a key technical juncture on the chart. This may include established support from a trend line, moving average, pivot, Fibonacci retracement, or a period-based low.
An "ideal" hammer formation would have the tail penetrate (or at least test) the key support level in question. The price then rallying and closing either at the high (bullish hammer) or just below it (bearish hammer). Either of these signal buyers coming back in and defending the key support level. Certain technical indicators like the Relative Strength Index (RSI) and others may be used to help validate this change in momentum back in favour of the buyers.
How to Use a Hammer as a Trade Signal
You can probably recognise by now that a hammer is rather similar to a pin bar reversal in terms of both construction and application in the market. And because of that, we trade qualifying hammer patterns using a strategy that is very similar to our pin bar reversal trading strategy.
Entry: Buy at hammer bar's high (plus spread, plus one pip)
Stop: Just below the hammer bar's low (minus spread, minus one pip)
Initial Price Target: Often, the most recent swing high
Risk: Typically, 1-2% of account capital, never any more
In the event that the trade is triggered and begins moving in your favour, risk-conscious traders may then opt to move the stop up to breakeven to protect against downside risk and preserve early profits. There are other strong technical signals such as the engulfing candle which forms part of candlestick patterns.
NEXT: Read Part 2 of this article, discussing smash bar patterns and how to use them in your trading.