When was the last time you heard the talking heads on TV arguing about a false breakout in some asset or currency pair, and then lauding all the exciting trading action that resulted from it? No doubt, they talked about two distinct groups of traders, the pros and veterans who spotted the false breakout and didn't get stuck on the wrong side of the trade, and the unfortunate group of new and/or inexperienced traders who did.
The firm's main research and development office is based in Tel Aviv Israel. It originally specialized in Forex and indices spreadbetting and CFDs but has recently expanded in stock trading also.
At the time of writing, eToro has 2.2 out of 5 star on Trust pilot. The comments suggest that the platform offers some impressive features but withdrawing money can be difficult. Having said that, some of the negative reviews appear to be rants rather than constructive criticism. This can be examples of traders losing money through their own recklessness rather than eToro's fault. You should therefore take this reviews with a pinch of salt.
“the platform offers some impressive features but withdrawing money can be difficult.”
76% of retail investor accounts lose money when trading CFDs with this provider.
OANDA is a global financial services company providing advanced currency solutions to both retail and corporate clients all over the world. In this article, we are going to review this broker’s trading options, tools, platforms, spreads, commissions, security measures, and educational resources to help traders make the right choice.
76.6% of retail investor accounts lose money when trading CFDs with this provider. You should consider whether you understand how CFDs work and whether you can afford to take the high risk of losing
AvaTrade offers a wide variety of trading solutions (spread trading, CFDs, and social trading), and peace of mind with its comprehensive regulation, covering the EU, Australia, Canada and South Africa. Clients can use a variety of platforms for discretionary and automated trading.
76% of retail investor accounts lose money when trading CFDs with this provider.
Offers multiple asset classes, platforms, and regulated in a variety of regions. Caters for a global audience. Awarded with the Highest Overall Customer Satisfaction Award for 5 years running - Investment Trends CFD Report 2015.
A standalone copy-trading ecosystem, providing equities, foreign exchange, commodities and cryptocurrencies markets. Provides a global selection of brokerages.
Pepperstone is a global regulated broker that provides its clients with the latest technologies for trading multiple assets such as Forex, indices, cryptocurrencies, stocks, ETFs, and commodities. This article provides an overview of its trading platforms, tools, fees, protection measures, and other aspects to help traders make a more informed decision.
Now, if this scenario sounds familiar, I know what you're thinking: "How do I spot false breakouts and ensure I'm on the right side of the trade from now on?" And that's a fine question, indeed, so I'll do my very best to show you in just a moment. But first, before we get there, let's make sure we let traders of all experience levels in on this lesson and tackle another important question in the process: "What is a false breakout to begin with?"
So, What Is a False Breakout, Anyway?
For those who don't know, a false breakout is a rather common condition in trading where price penetrates known support or resistance on the chart, but ultimately lacks the momentum needed to sustain the move. So rather than a breakout and continuation of the trend, we instead get a "fakeout," or a pretty strong and decisive reversal in the opposite direction, as would have been expected if the initial support or resistance on the chart had held in the first place. As seen on the chart at left, courtesy ofInvestopedia, price pierces the horizontal support level—which occurs as part of the triangle pattern on the chart—before reversing strongly back to the up side. And with that, you have an infamous false breakout.
Imagine also, if you can, having to deal with scenarios like this without much time to think or react, which is precisely the plight of intraday traders, who face the prospects of false breakouts multiple times each day. They are trading hourly and/or minute-based charts, afterall!
Forlonger-term traderslike us, though, we have the benefit of time being in our favour, so when navigating potentially treacherous false breakout patterns on the charts, there are some helpful solutions at our disposal. So let's check out what those solutions are…
How to Spot—and (Potentially) Trade—False Breakouts
By now, we've answered our first question—what is a false breakout—but the second component of this lesson is what traders should do whenever a (potential) false breakout materialises. And while this may not sound all that insightful, the first piece of advice I want to give you about trading false breakouts is this: Even once the key support or resistance level has been breached, wait for the ensuing price action before executing any trades in either direction.
Why is it better to wait, you wonder? Well, it's because when trading the higher time frames like the daily or weekly, you want to make trading decisions that factor in the closing price of critical bars such as those that interact with key price levels. And fortunately, that's a luxury afforded to you by long-term trading, as well as supported by the Lazy Trader methodology.
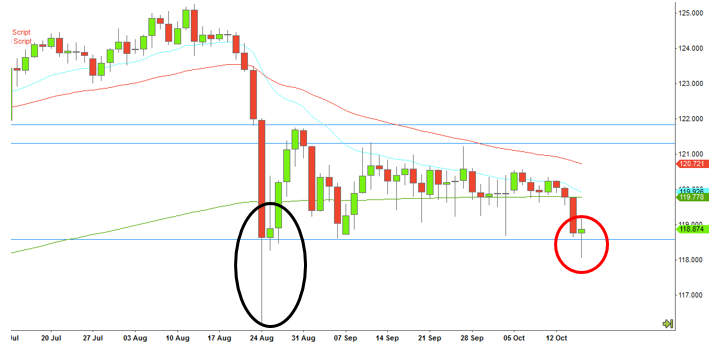
See the below daily chart of USDJPY, for example, particularly the red circle at the far right, where price can be seen penetrating the lower range boundary intraday before ultimately reversing and closing above it to end the day.
How to Trade False Breakouts
For longer-term traders, to assume that a breakout was in progress as soon as the support was broken earlier in the day would've been a mistake, primarily because a breakout shouldn't be deemed valid without a close (in this case) below key support. This is all the more true when considering price had traded below that support previously (see black oval).
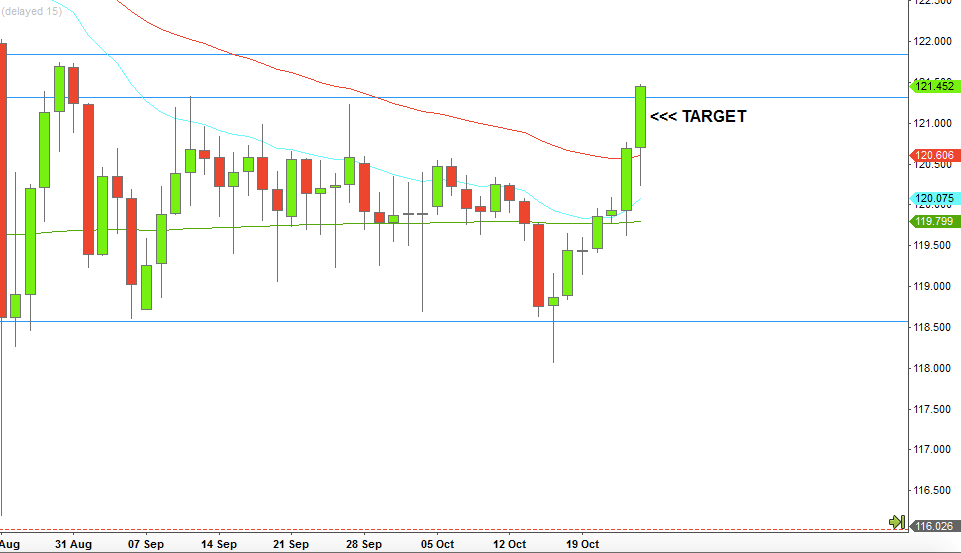
As it did in this case, waiting for the daily bar to officially print at day's end offered a bullish signal that contradicted the bearish one that initially came from the break of support earlier that day. In fact, to us, the bullish pin bar reversal near key support was a valid buy signal and a sort of "launchpad" for the decisive move to the up side that resulted (see below chart); the very same move that took out any traders who were too quick to enter short on the initial breakout, which turned out to be false.
Technical Analysis: "False Breakout" Set-up in USD/JPY
This particular example aside, though, let's round out today's discussion with a few pieces of advice to keep in mind when deciding whether a breakout is true or false, and what to consider whenever taking trades in the "decision zone" that always surrounds key support and resistance on the charts:
Trade End of Day Instead
Don't be so quick to call it a breakout just because a price level is taken out intraday. If, however, the day's close confirms the breakout, well, then you might have a tradeable pattern you can act upon. But as you saw in the USDJPY example above, it would've been a mistake to trigger the trade earlier in the day. Here, too, is the benefit of trading end of day, as well as trading longer-term charts, because you have more time, and additional bars, to use in planning and executing your trades.
Consult Momentum Indicators
Among the other tools at our disposal when trying to decipher a breakout from a fakeout are momentum indicators like the Relative Strength Index (RSI) as well as the ever-popular moving averages. And while price action alone is used to govern our trade decisions, these indicators may be used in concert to measure momentum occurring alongside a possible breakout, which can help confirm or contradict the likelihood of a breakout from that point.
Let the Subsequent Bar(s) Tell the Real Story
Even after the initial break of support or resistance, longer-term traders have—and must leverage—the benefit of time being in their favour. With that, our methodology won't trigger us into the trade until the next bar at the earliest, a condition that provides a safety net if, in fact, price does react unexpectedly. See how relying on the subsequent bars—and especially any pin bars—rather than basically guessing about the breakout based on only the current one can make for more informed trade decisions?


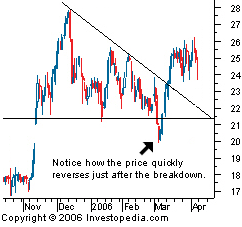 For those who don't know, a false breakout is a rather common condition in trading where price penetrates known support or resistance on the chart, but ultimately lacks the momentum needed to sustain the move. So rather than a breakout and continuation of the trend, we instead get a "fakeout," or a pretty strong and decisive reversal in the opposite direction, as would have been expected if the initial support or resistance on the chart had held in the first place. As seen on the chart at left, courtesy of